Figures & data
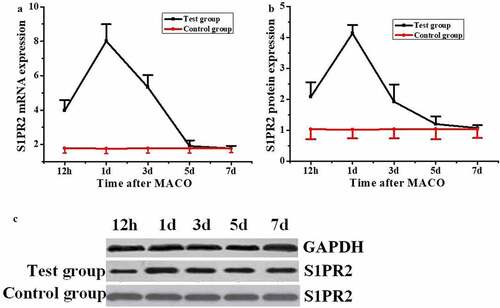
Figure 1. Frame diagram of the main contents of this study
Figure 2. Primary BMPs identified by immunofluorescence co-staining of α-SMA and PDGFR-β
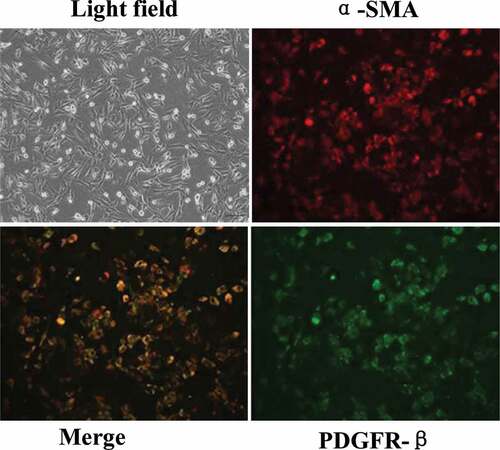
Figure 3. Changes of S1PR2 expression in pericytes of MCAO model rats
(A: changes of S1PR2 mRNA level in pericytes detected by q RT-PCR; B: protein expression of S1PR2 detected by Western blot; C: image of S1PR2 protein expression.)
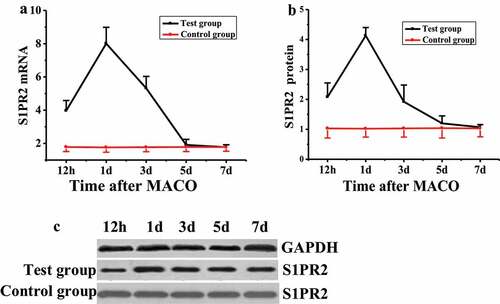
Figure 4. Changes of S1PR2 expression in pericytes of control group and test group at different time points after MCAO modeling
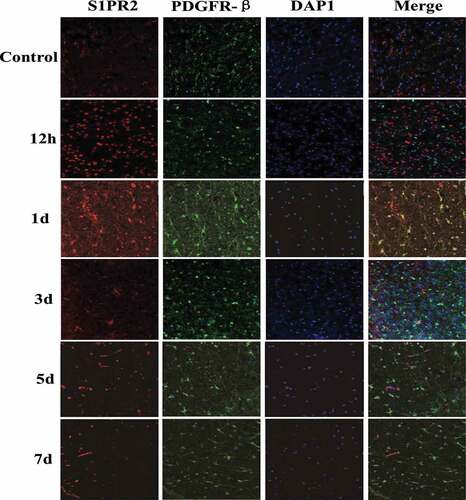
Figure 5. Detection of MMP9 protein content
(A: staining results of MMP9 protein expression in rat brain tissue, a: the control group; b: the test group; B: comparison of MMP9 protein content in brain tissue between the two groups, * indicated significant difference compared with the control group, P < 0.05)
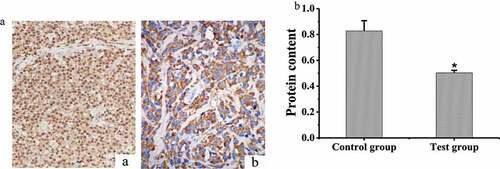
Figure 6. Comparison of SODs mRNA levels between test group and control group
(* indicated significant difference compared with the control group, P < 0.05)
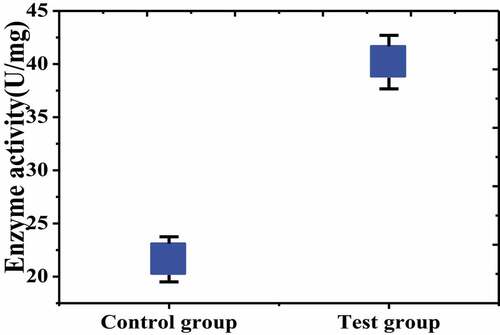
Figure 7. Comparison of SODs enzyme activity between the two groups