Figures & data
Table 1. Primers used in this research
Figure 1. The cDNA of MsPYR1 and its encoded amino acid sequence
Figure 2. Comparison of the predicted protein sequence of BrcSPL8 with other SPL8 proteins
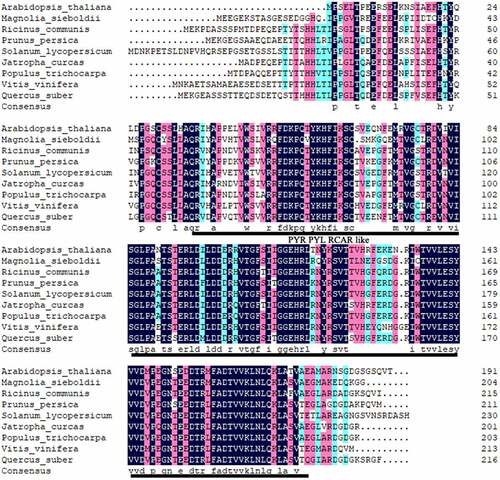
Figure 3. Sequence alignment of MsPYR1 and PYR1 from different plants
Table 2. The amino acid composition of MsPYR1 gene encodes the protein
Figure 4. Prediction of three-dimensional structure of MsPYR1 protein
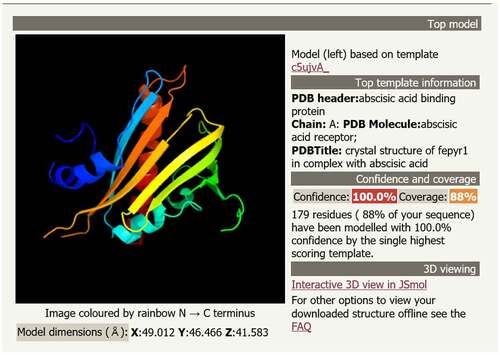
Figure 5. Expression of MsPYR1 gene in different stratification stages
Figure 6. Analysis of the expression of recombinant pPID1 by SDS-PAGE Lanes 1: 0 mM IPTG induction. Lanes 2,3: 0.5 mM IPTG induction. Lan M: protein molecular weight marker
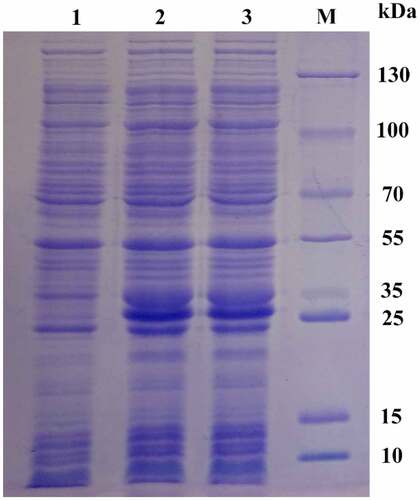
Figure 7. SDS–PAGE of purified recombinant protein MsPYR1 Lane 1: the precipitate of the crude cell lysate. Lan 2: the supernatant of the crude cell lysate. Lan 3: effluent fractions of loading sample. Lan 4: the fraction of the first elution with 20 mM imidazole eluate fractions. Lan 5: the fraction of the first elution with 250 mM imidazole eluate fractions. Lan 6: residual fraction. Lan M: protein molecular weight marker
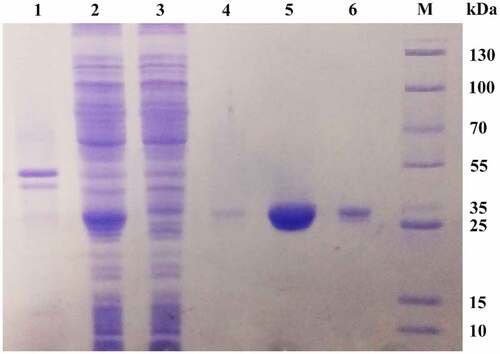
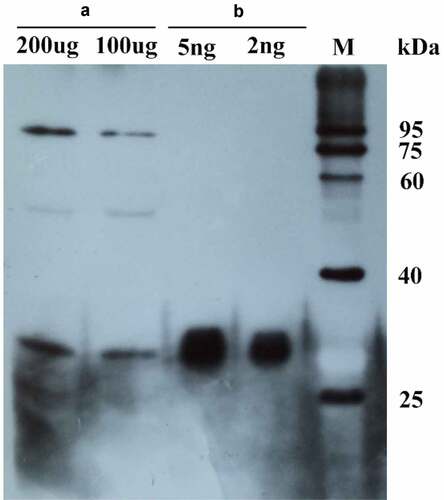
Figure 8. The purified MsPYR1 protein and seed protein was detected by western blotting analysis. A: M. sieboldii seed protein. B: MSPYR1 recombinant protein. M: protein molecular weight marker