
Figures & data
Table 1. The primers used in this study for RT-PCR
Figure 1. The distinct upregulation of MEOX2-AS1 in CC and its clinical significance. (a) The levels of MEOX2-AS1 in 117 patients using RT-PCR. (b) The diagnostic value of MEOX2-AS1 expressions was determined by ROC assays. (c) The comparison of MEOX2-AS1 levels between CC specimens with different stages. (d) The diagnostic value of MEOX2-AS1 for advanced CC specimens. (e)In different CC cell lines, MEOX2-AS1 levels were examined. (f, g) Kaplan-Meier curves for OS and DFS in 117 patients with CC divided based on MEOX2-AS1 expressions. **P < 0.01
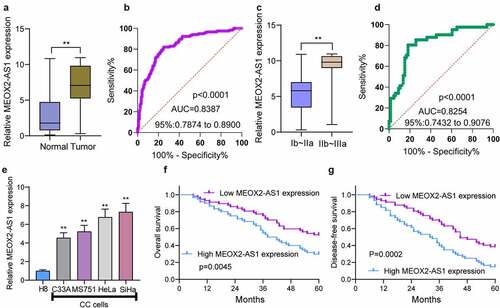
Table 2. Clinicopathological features associated with MEOX2-AS1 expression in 117 CC patients
Table 3. Multivariate analysis of overall survival and disease-free survival in 117 patients with CC
Figure 2. STAT1 activates the transcription of MEOX2-AS1. (a) JASPAR predicted STAT1 binding site prediction in the MEOX2-AS1. we obtained DNA motif of STAT1 and predicted three binding sites of STAT1 in MEOX2-AS1 promoter. (b) The STAT1 expressions in 306 CC specimens and 13 non-tumor cervical specimens from TCGA datasets. (c) The expressions of STAT1 in our cohort. (d) RT-PCR determined STAT1 expressions in different CC cell lines. (e, f) STAT1 and MEOX2-AS1 expressions in CC cells transfected with si-STAT1 or si-NC. (g) Construction of the luciferase reporter vector. (h) Luciferase activity was distinctly decreased in si-STAT1-transfected cells compared with control vector in three binding sites. **P < 0.01, *p < 0.05
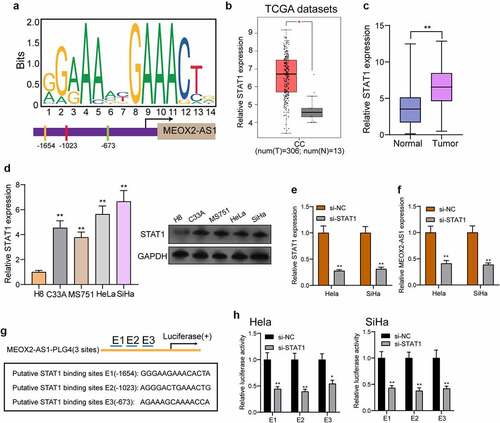
Figure 3. Silence of MEOX2-AS1 suppressed the proliferation of CC cells. (a) MEOX2-AS1 expressions in CC cells, transfected with sh-MEOX2-AS1-1, sh-MEOX2-AS1-2 or sh-NC, were tested by qRT-PCR. (b) The proliferative abilities of Hela and SiHa cells were determined through CCK8 assays. (c) Colony formation assays. (d) Tumors from sh-MEOX2-AS1 group and sh-NC group were displayed. (e,f)Volume and weight of tumors obtained were shown. **p < 0.01, ***p < 0.001
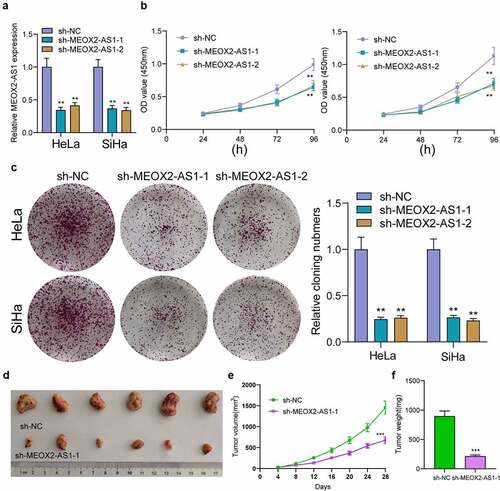
Figure 4. Knockdown of MEOX2-AS1 decreases the invasion and migration potential of Hela and SiHa cells. (a) representative images and quantitative analysis of scratch assays, delayed closure was observed in CC cells with MEOX2-AS1 knockdown. (b) Transwell assays demonstrated the anti-invasive ability of sh- MEOX2-AS1-1 and sh-MEOX2-AS1-2. (c) Western blot assays of EMT pathways. **p < 0.01
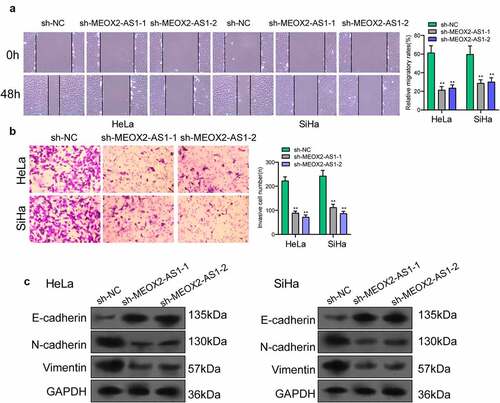
Figure 5. MEOX2-AS1 acts as a sponge for miR-143-3p. (a) Subcellular fractionation assays for the location of MEOX2-AS1 in SiHa and Hela cells. (b) The prediction of the putative miRNAs targeting MEOX2-AS1 using miRcode and StarBase 3.0. (c,d)RT-PCR for the detection of the miRNA levels in MEOX2-AS1-depleted Hela and SiHa cells. (e) Decreased levels of miRNA-143-3p were observed in CC. (f) RT-PCR confirmed decreased expression of miR-143-3p in four CC cells compared to H8 cells. (g) The diagnostic value of miRNA-143-3p expressions in our cohort. (h) Pearson’s correlation coefficient showed the relationship between miR-143-3p and MEOX2-AS1 in the 117 CC tissues. (i) Schematic outlining the predicted binding sites between MEOX2-AS1 and miR-143-3p. (j) MiR-143-3p mimics promoted the expression of miR-143-3p in Hela and SiHa cells. (k) MiR-143-3p mimics obviously reduced the luciferase activity of MEOX2-AS1-WT. **p < 0.01
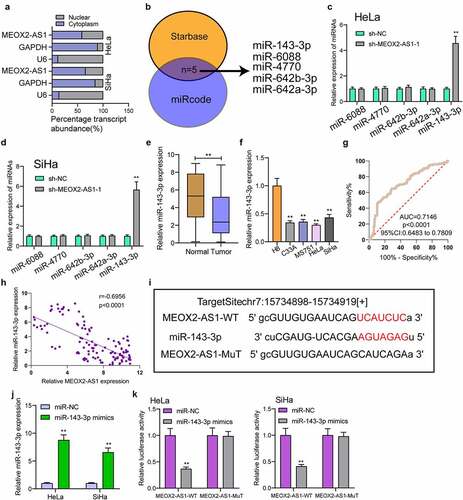
Figure 6. VDAC1 was a direct target of miR-143-3p. (a) Schematic construction of WT and Mut 3ʹ-UTR of VDAC1 were displayed. (b) VDAC1 expression in 306 CC tissues and 13 non-tumor samples(TCGA datasets). (c,d) Kaplan-Meier curves for OS and DFS in 292 patients with CC. (e) The expression of VDAC1 in different CC cells. (f,g) Dual luciferase reporter assays demonstrated the functions of miR-143-3p mimics on the activity of the 3ʹUTRs of VDAC1 in Hela and SiHa cells. (h) The levels of MEOX2-AS1 and VDAC1 in Hela cells transfected with miR-NC or miR-143-3p mimics. (i) The levels of MEOX2-AS1 and VDAC1 in Hela cells transfected with NC inhibitors or miR-143-3p inhibitors. ***p < 0.001 **p < 0.01, *p < 0.05
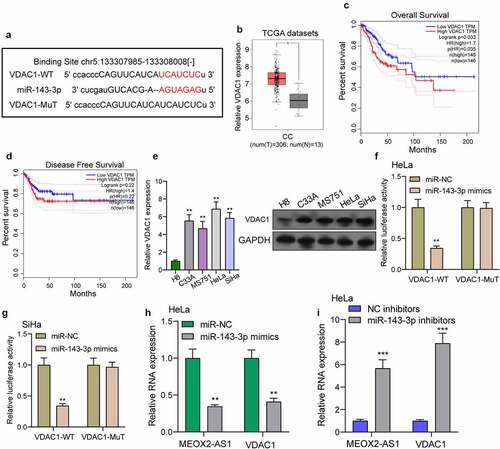
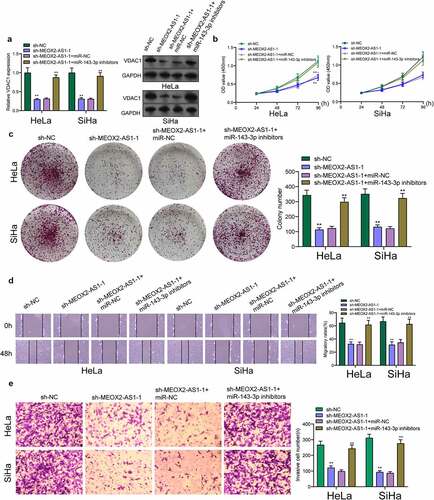
Figure 7. Knockdown of miR-143-3p attenuates the regulatory functions of MEOX2-AS1 silence on the progression of CC cells. (a) The expression levels of VDAC1 in SiHa and Hela cells after knockdown of MEOX2-AS1 and/or inhibition of miR-143-3p. The CCK-8 assays (b), colony formation assays (c), Cell migration(d) and cell invasion assays (e) following knockdown of MEOX2-AS1 and/or inhibition of miR-143-3p. *p < 0.05, **p < 0.01
Data availability statement
All data that support the findings of this study are available from the corresponding authors upon reasonable request.