
Figures & data
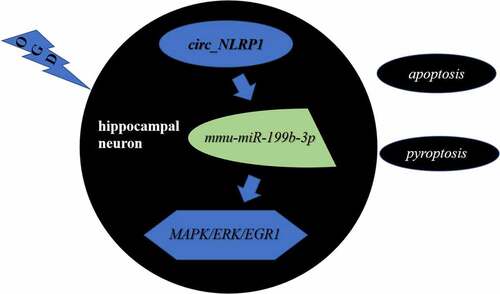
Figure 1. MCAO and OGD treatment increased circ_NLRP1 levels and OGD treatment reduced cell viability in primary hippocampal neurons in time-dependent manner. The expression of circ_NLRP1 through the analysis of RT-qPCR, n = 6. (a). Light microscopy of hippocampal neurons(A). The expression analysis of circ_NLRP1 through RT-qPCR (b). The detection of cells viability through CCK8 assay (c). **p < 0.01, ***p < 0.001
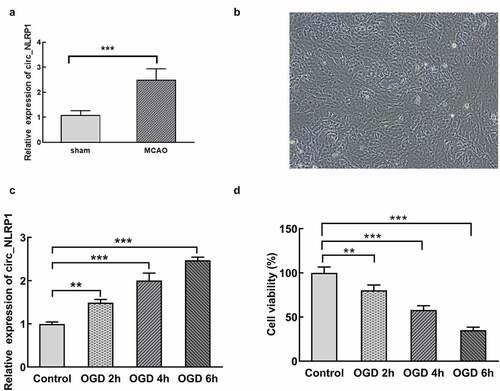
Figure 2. The effects of circ_NLRP1 on viability, LDH release and apoptosis in mouse hippocampal neuronal cells treated by OGD. The transfection efficacy of shRNA-circ_NLRP1-1 or shRNA-circ_NLRP1-2 by qPCR analysis (a). The analysis of cell viability through MTT assay (b), the LDH release through LDH kit (c), cell apoptosis through TUNEL kit (d–e) in cells undergoing shRNA-circ_NLRP1-1 or shRNA-circ_NLRP1-2 transfection for 24 h and then OGD treatment for 4 h. ***p < 0.001. ##p < 0.01, ###p < 0.001
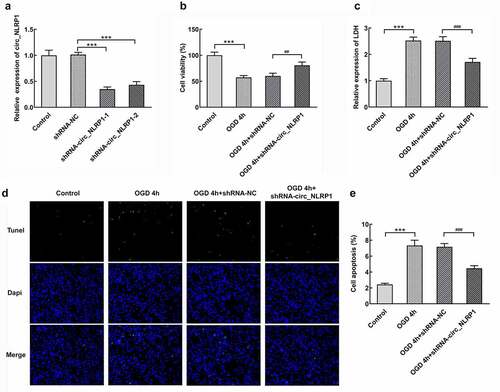
Figure 3. The effects of circ_NLRP1 on NLRP3-mediated pyroptosis pathway in OGD-induced in mouse hippocampal neuronal cells. The immunofluorescence analysis of GSDMD-N (a–b). The RT-qPCR (b) and the western blotting analysis (c–d) of pyroptosis-related proteins and pannexin-1. ***p < 0.001, ###p < 0.001
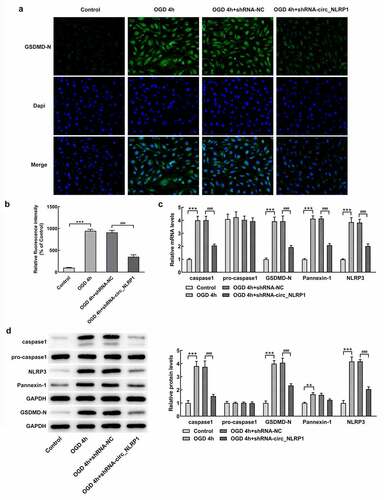
Figure 4. Effect of circ_NLRP1 silencing on expression of mmu-miR-199b-3p in mouse hippocampal neuronal cells under OGD stimulation. The upregulation of mmu-miR-199b-3p expression after OGD treatment. The result of luciferase assay (b). The elevation of mmu-miR-199b-3p expression after circ_NLRP1 silencing (c). ***p < 0.001, ###p < 0.001
Figure 5. Mmu-miR-199b-3p mediated the function of circ_NLRP1. The effects of mmu-miR-199b-3p-inhibitor through qPCR analysis (a). The effects of mmu-miR-199b-3p-mimic through qPCR analysis (b). mmu-miR-199b-3p-inhibitor disturbed the effects of shRNA-circ_NLRP1 on cell viability (c), LDH (d) or cell apoptosis (e–f). **p < 0.01, ***p < 0.001. #p < 0.05
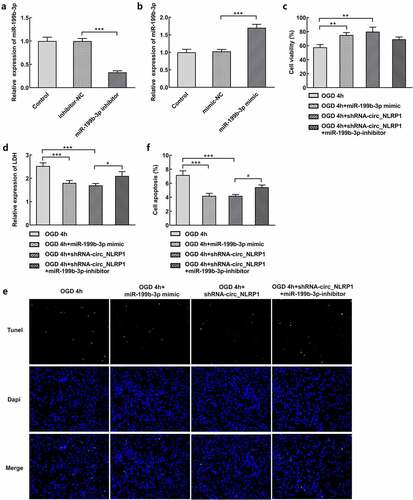
Figure 6. The regulation of circ_NLRP1 for pyroptosis via circ_NLRP1
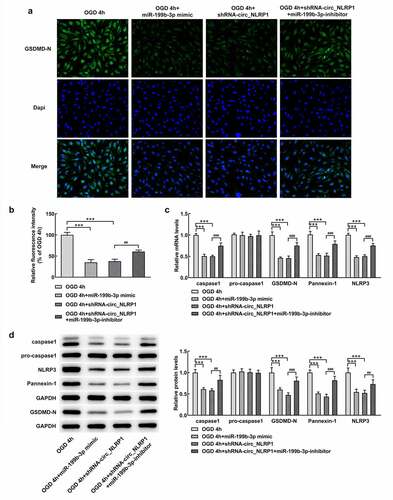
Figure 7. The regulation of circ_NLRP1 fo ERK/EGR1 pathway via circ_NLRP1. The analysis of MAPK pathway through Western blotting. *p < 0.01, ***p < 0.001. ##p < 0.05
Data availability statement
The experimental data were available from correspondence author based on a reasonable request.