Figures & data
Figure 1. Survival analysis for survival rate of EC patients divided into the high- or low-score groups by comparison to the median value of each score. (a) Kaplan-Meier curve for EC patients in Immune score. (b)Kaplan-Meier curve for EC patients in Stromal score. (c) Kaplan-Meier curve for EC patients in ESTIMATE score
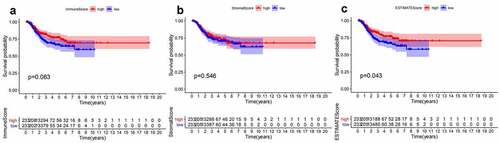
Figure 2. Heatmaps, Venn plots, and enrichment analysis for DEGs. (a-b) Heatmap of DEGs generated from the comparison of the high score group vs. the low score group in Immune score and Stromal score. Red indicates genes with higher expression level and blue indicates genes with lower expression. The top 50 genes are listed as the row name of the heatmap. (c) Veen plot presenting the intersection of up- and down-regulated DEGs shared by Immune score and Stromal score. (d-e) GO and KEGG enrichment analysis for 387 common DEGs
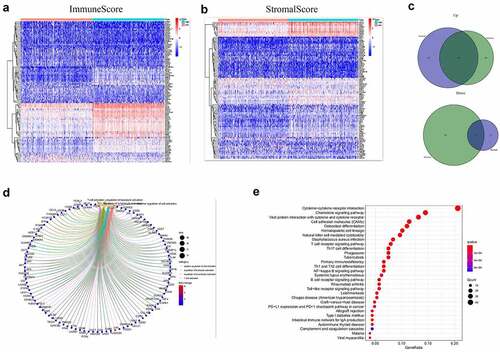
Figure 3. Protein-protein interaction network and univariate COX regression analysis. (a) PPI network showing the nodes with an interactive confidence score > 0.95. (b) The list of top 30 DEGs ordered by the number of nodes. (c) Venn plot showing the common gene obtained from the PPI network and univariate Cox analysis
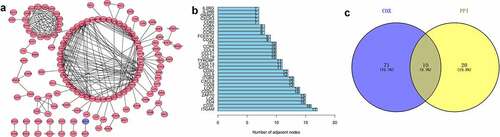
Figure 4. Kaplan-Meier survival of disease-free analysis for EC patients with CCR2, CD3D, CD3E, CD3G, CD4, CD247, CXCR3, IL2RB, IL2RG and ZAP70 high or low expression
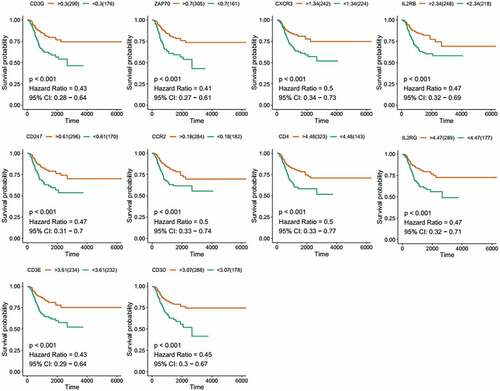
Figure 5. The prognostic value of CCR2 in EC patients. Different expression of CCR2 and other nine genes in the normal and tumor sample
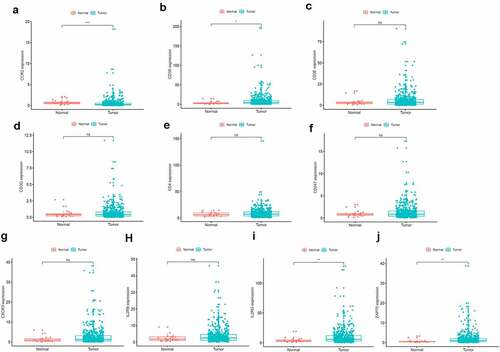
Figure 6. Analysis of CCR2. (a) CCR2 expression in tumor vs. normal sample. (b) CCR2 expression in the normal and tumor sample of the same patient. (c-d) GSEA analysis for samples with high- and low-expression of CCR2. (e-j) Association with CCR2 expression and clinical factors. The Kruskal-Wallis or Wilcoxon rank sum test used as the statistical analysis. (k-n) The distributions of immune score, stromal score, ESTIMATE score and tumor purity in H- and L-CCR2 group
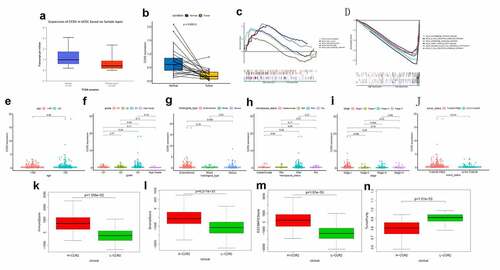
Figure 7. The Univariate Cox analysis (a) and multivariate Cox analysis (b) containing clinical factors and CCR2 (P < 0.05)
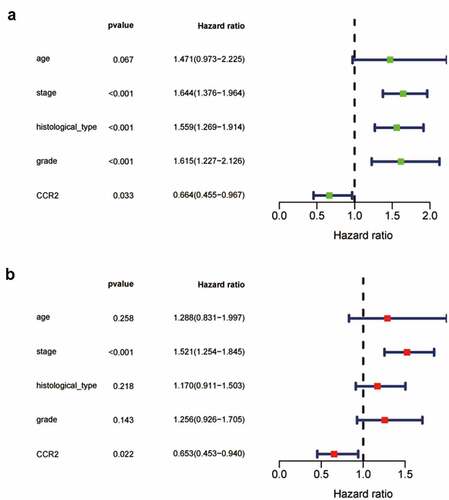
Figure 8. The identification of CCR2 in endometrial carcinoma. (a) The result of qRT-PCR in 11 pairs of tumors and adjacent tissues showed that the transcriptome level of CCR2 was significantly reduced in tumor tissues (P < 0.01). (b) Representative images show the samples stained with CCR2 from the HPA database. The staining intensity was negative in tumor cells, but strong in normal tissue. (c-d) The proportion and distribution of samples with genetic alterations of CCR2 in EC. (e) Correlation between CCR2 methylation level and its expression in EC
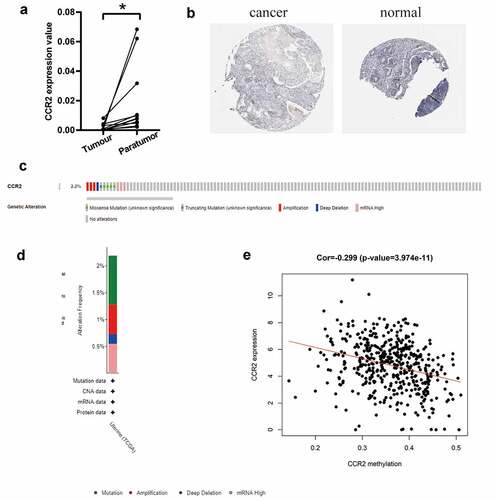
Figure 9. The association of CCR2 expression and the proportion of TICs. (a) Violin plot showing the proportion of 22 kinds of immune cells with high- and low-expression of CCR2 in EC samples (Wilcoxon rank sum test). (b) Scatter plot displayed the correlation of 11 kinds of TICs proportion with the CCR2 expression, p < 0.05 as statistically significant. (c) Venn plot presented 11 kinds of TICs correlated with CCR2 expression codetermined by difference and correlation tests
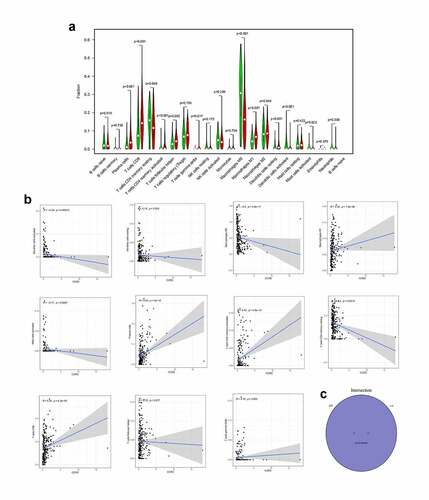
Table 1. Correlation analysis between CCR2 and related gene markers of immune cells
Figure 10. Correlation analysis between CCR2 and immune infiltration level. (a) TIMER analysis of purity-corrected partial Spearman’s correlation between the expression of CCR2 and six immune cells in EC. (b) Correlation analysis between the expression of CCR2 and 24 immunoinhibitory across human cancers by TISIDB. (c) Correlation analysis between the expression of CCR2 and 46 immunostimulatory across human cancers by TISIDB. (d)Correlaion analysis between the expression of CCR2 and MHCs across human cancers by TISIDB. (e)The correlation of CCR2 and immune subtypes in UCEC (C1 (wound healing); C2 (IFN-gamma dominant); C3 (inflammatory); C4 (lymphocyte depleted); C5 (immunologically quiet); C6 (TGF-b dominant)). (f) The correlation of CCR2 and molecular subtypes in UCEC
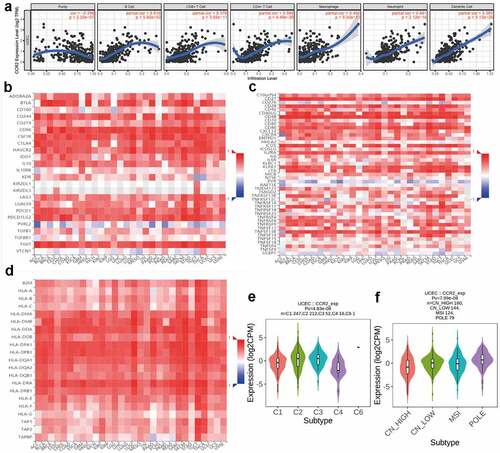
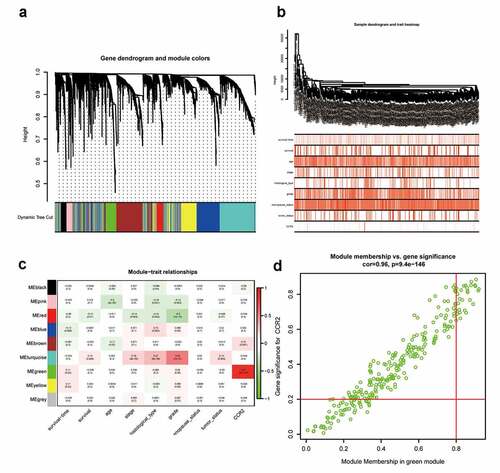
Figure 11. Screening for modules and genes related to CCR2 in EC. (a) Clustering dendrogram of EC patients from the TCGA dataset. (b) A total of 4463 DEGs were clustered based on the dissimilarity measure (1-TOM) and were divided into nine modules. (c) A correlation heatmap between module eigengenes and clinical parameters (CCR2 expression was used as the main research object) of EC. (d) Scatter plot of green module eigengenes