
Figures & data
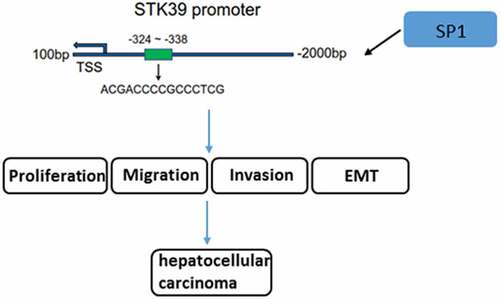
Figure 1. STK39 was up-regulated in HCC and predicts poor prognosis
(a) The expression of STK39 in liver hepatocellular carcinoma (LIHC, right group) and normal (left group) tissues was analyzed using GEPIA database. *P < 0.05. (b) The expression of STK39 in different pathological stages of HCC was analyzed using GEPIA database. (c,d) The correlation between STK39 expression and overall survival or disease-free survival of HCC was analyzed using GEPIA database. (E-F) The mRNA and protein expression of STK39 in human normal HHL-5 hepatocytes and human HCC cell lines including MHCC97-H, SK-Hep-1, Huh-7 and Hep3b was tested by RT-qPCR and western blot analysis. *P < 0.05 and ***P < 0.001 vs HHL-5.
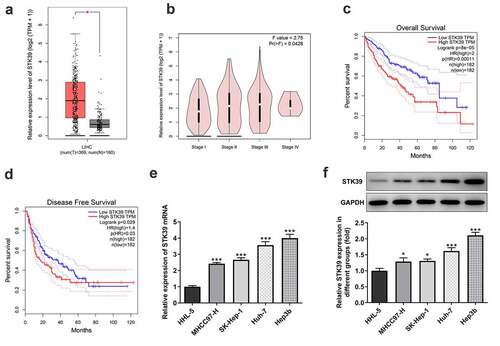
Figure 2. STK39 knockdown inhibited proliferation and induces apoptosis of Hep3b cells
(a,b) The mRNA and protein expression of STK39 in control Hep3b cells or cells that transfected with indicated shRNAs was determined with RT-qPCR and western blotting. ***P < 0.001 vs Control; #P < 0.05 and ###P < 0.001 vs shRNA-NC. (c,d) Colony formation assay was performed to observe cell proliferation. (e) Cell viability at 24, 48 and 72 h was measured respectively by means of MTT assay. (f,g) Cell apoptosis was observed using Tunel staining (×200); (h) The protein expression of Bax and Bcl-2 was detected via western blot assay. *P < 0.05, **P < 0.01, ***P < 0.001 vs Control; #P < 0.05, ##P < 0.01 and ###P < 0.001 vs shRNA-NC.
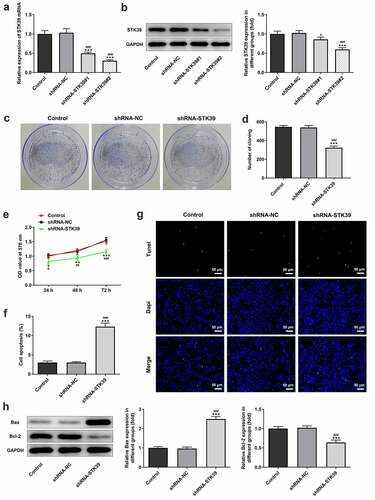
Figure 3. STK39 knockdown suppressed migration, invasion, EMT and TGF-β1/Smad2/3 signaling of Hep3b cells
(a,b) Hep3b cells were transfected with shRNA-NC or shRNA-STK39 or not, then cell migration was assessed using wound healing assays. (c-d) Cell invasion was evaluated with transwell assay. (e) The protein expression of MMP2 and MMP9 was detected using western botting. (f,g) The expression of EMT-related proteins including vimentin, E-cadherin and N-cadherin was assessed by means of western blot assay. (h) TGF-β1, p-Smad2/Smad2 and p-Smad3/Smad3 expression was detected using western blot. **P < 0.01 and ***P < 0.001 vs Control; ##P < 0.01 and ###P < 0.001 shRNA-NC.
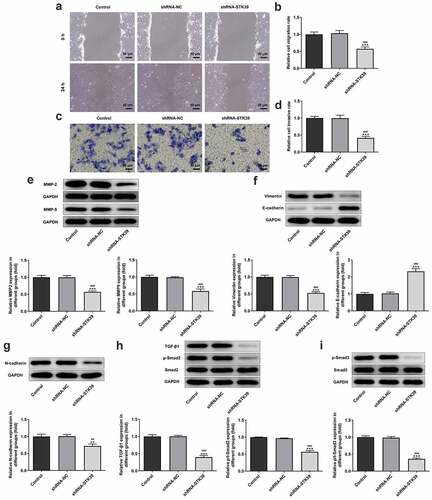
Figure 4. The relationship between SP1 and STK39
(a,b) The expression correlation and binding sequences between SP1 and STK39 was analyzed using GEPIA database. (c) The result of dual-luciferase report assay. ***P < 0.001 vs STK39-WT + pcDNA3.1. (d) Chromatin immunoprecipitation (ChIP) assay was adopted to detect the interaction between STK39 and SP1. ***P < 0.001 vs IgG. (e-f) The transfection efficiency of SP1 overexpression in Hep3b cells. **P < 0.01 and ***P < 0.001 vs Control; ##P < 0.01 and ###P < 0.001 vs pcDNA3.1. (g,h) The mRNA and protein expression of STK39 in Hep3b cells that transfected with indicated vectors was examined with RT-qPCR and western blot assay. ***P < 0.001 vs Control; ###P < 0.001 vs shRNA-NC; $$$P < 0.001 vs shRNA-STK39; &&&P < 0.001 vs shRNA-STK39+ pcDNA3.1.
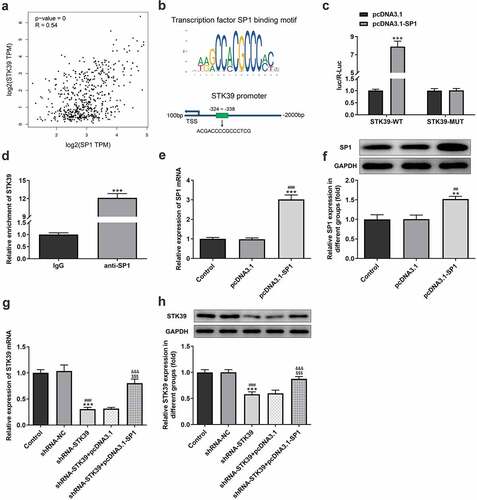
Figure 5. SP1 overexpression blocked the effect of STK39 knockdown on Hep3b cells proliferation and apoptosis
(a) Cell viability of Hep3b cells that transfected with indicated vectors was evaluated by MTT assay. (b,c) Representative colony formation assay for Hep3b cells that transfected with indicated vectors. (d,e) Representative images and quantitative analysis for Tunel staining in Hep3b cells that transfected with indicated vectors (×200). (f) The proteins expression of Bax and Bcl-2 in Hep3b cells that transfected with indicated vectors was tested using western blot analysis. *P < 0.05, **P < 0.01, ***P < 0.001 vs Control; #P < 0.05, ##P < 0.01 and ###P < 0.001 vs shRNA-NC; $$P < 0.01 and $$$P < 0.001 vs shRNA-STK39; &&P < 0.01 and &&&P < 0.001 vs shRNA-STK39+ pcDNA3.1.
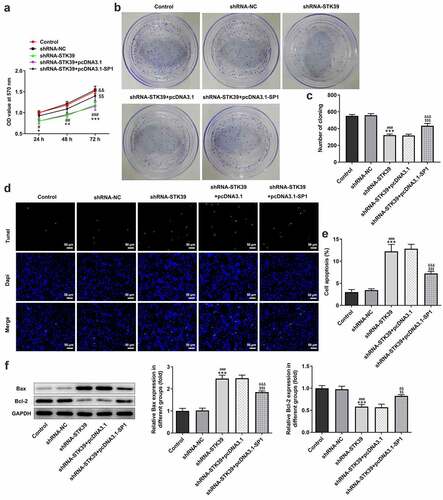
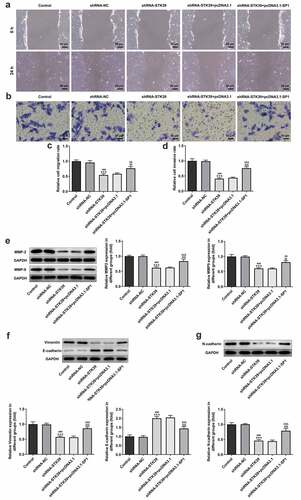
Figure 6. SP1 overexpression alleviated the effect of STK39 knockdown on Hep3b cells migration, invasion and EMT
(a,d) Cell migration and invasion were respectively assessed using wound healing assay and transwell assay. (e,g) The protein expression of MMP2, MMP9, vimentin, E-cadherin and N-cadherin were detected using western blot assay. ***P < 0.001 vs Control; ###P < 0.001 vs shRNA-NC; $$P < 0.01 and $$$P < 0.001 vs shRNA-STK39; &&P < 0.01 and &&&P < 0.001 vs shRNA-STK39+ pcDNA3.1.
Availability of data and materials
The datasets generated and/or analyzed during the current study are available on reasonable request.