Figures & data
Figure 1. The effects of Anagliptin on cell viability of vascular smooth muscle cells. Cells were stimulated with Anagliptin at the concentrations of 0.1, 0.25, 0.5, 2.5, 5, 25, and 50 μM for 24 hours. (a). Molecular structure of Anagliptin; (b). Cell viability; (c). Release of LDH (*, **, P < 0.05, 0.01 vs. vehicle group)
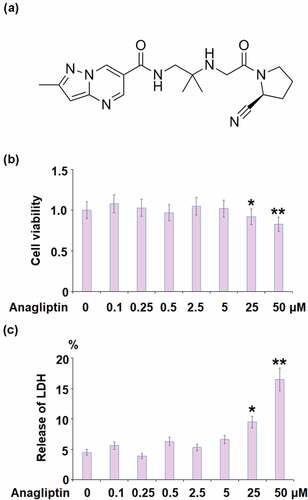
Figure 2. Anagliptin reduced IL-1β- induced pro-inflammatory cytokines. (a-c). mRNA of TNF-α, IL-6, and MCP-1; (d-f). Secretions of TNF-α, IL-6, and MCP-1 (****, P < 0.0001 vs. vehicle group, ##, ###, P < 0.1, 0.001 vs. IL-1β group)
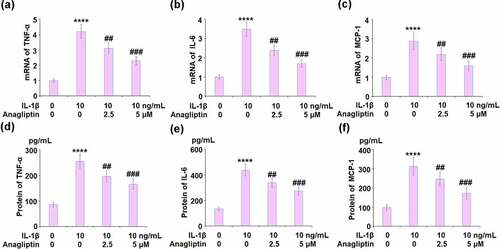
Figure 3. Anagliptin restored IL-1β-induced reduction of telomerase activity. Telomerase activity was measured using a commercial kit (****, P < 0.0001 vs. vehicle, ##, ###, P < 0.1, 0.001 vs. IL-1β)
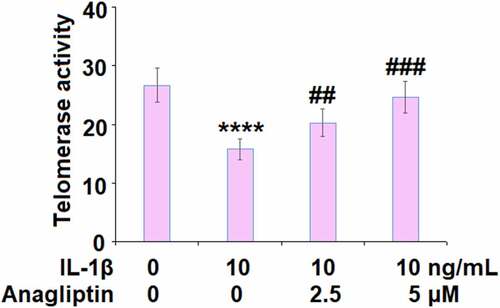
Figure 4. Anagliptin prevented IL-1β-induced cellular senescence. Cellular senescence was assayed using SA-β-gal staining. Scale bar, 100 μM (****, P < 0.0001 vs. vehicle, ##, ###, P < 0.1, 0.001 vs. IL-1β)
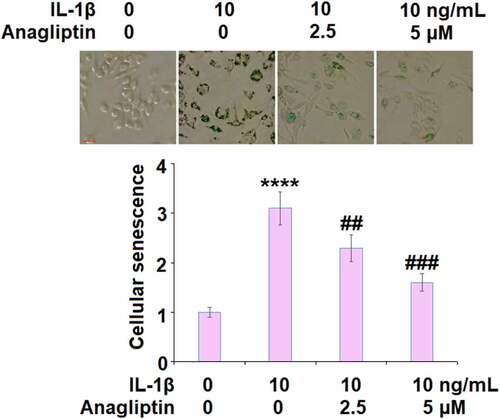
Figure 5. Anagliptin prevented IL-1β-induced p16 and p21. (a). mRNA of p16 and p21; (b). Protein of p16 and p21 (****, P < 0.0001 vs. vehicle group, ##, ###, P < 0.1, 0.001 vs. IL-1β group)
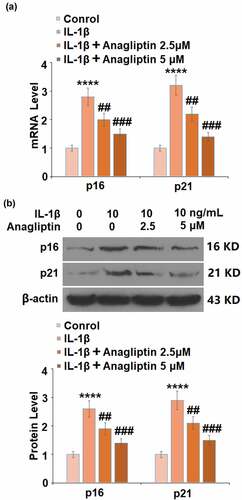
Figure 6. Anagliptin restored IL-1β-induced expression of SIRT1. (a). mRNA of SIRT1; (b). Protein of SIRT1 (****, P < 0.0001 vs. vehicle, ##, ###, P < 0.1, 0.001 vs. IL-1β)
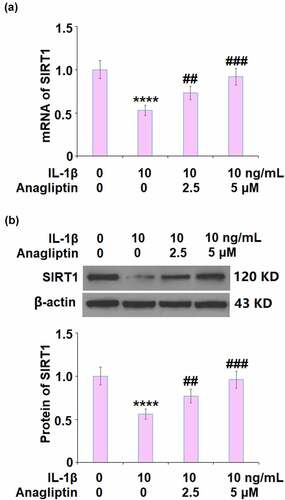
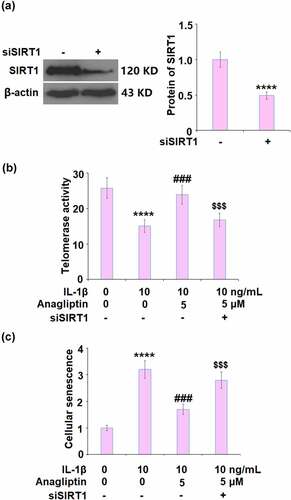
Figure 7. Silencing of SIRT1 abolished the protective effects of Anagliptin against IL-1β- induced cellular senescence. (a). Successful knockdown of SIRT1; (b). Telomerase activity; (c). Cellular senescence (****, P < 0.0001 vs. vehicle, ###, P < 0.001 vs. IL-1β; $$$, P < 0.001 vs. IL-1β+ Anagliptin group)