Figures & data
Figure 1. Clinical value assessments of splicing factors (SFs). (a) Heatmap of differentially expressed SFs. (b) Bubble plots display the prognostic value of differentially expressed SFs
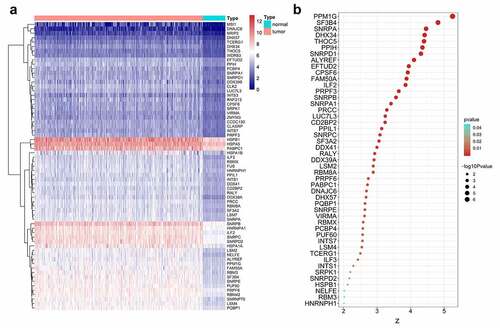
Figure 2. Interactions and relationships among clinically relevant splicing factors (SFs). (a) The protein-protein interaction network revealed the close interrelationship among SFs. (b) Heatmap of the correlation coefficients of these SFs. (c) Enrichment pathways of clinically relevant SFs
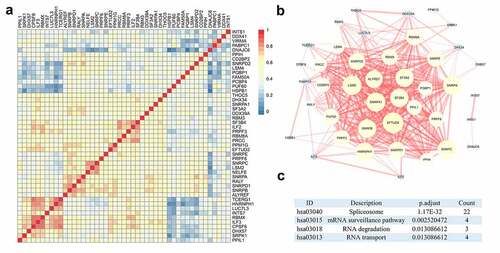
Figure 3. Gene ontology terms for clinically relevant splicing factors (SFs). (a) Biological process; (b) Cellular component; (c) Molecular function
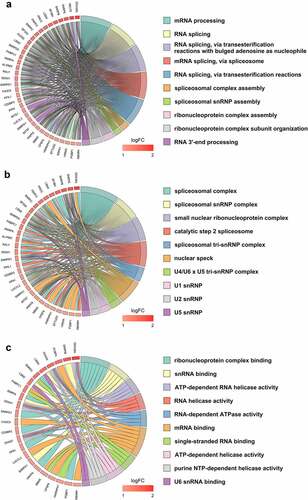
Figure 4. Splicing factors clusters associated with distinct prognosis. (a) Consensus matrix heatmap defined three clusters of samples for which consensus values range from 0 (in white, samples never clustered together) to 1 (dark blue, samples always clustered together). (b) Kaplan-Meier survival analysis of patients within different clusters on overall survival
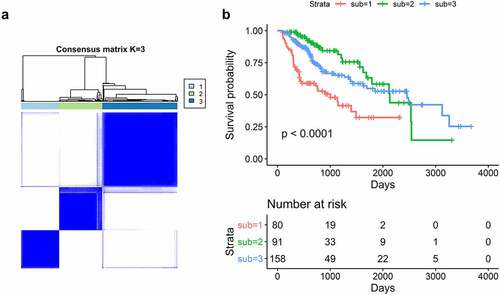
Figure 5. Heatmap of splicing factors clusters. Heatmap of the 329 HCC patients ordered by cluster, with annotations associated with each cluster
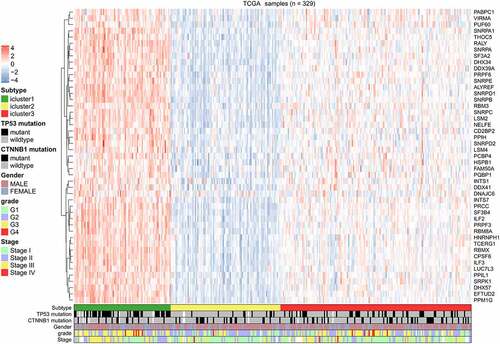
Figure 6. The relationship between molecular characteristics and subtypes. (a)TNM stage; (b) Histological grade; (c) TP53 mutation; (d) CTNNB1 mutation; P-values are from chi-square tests
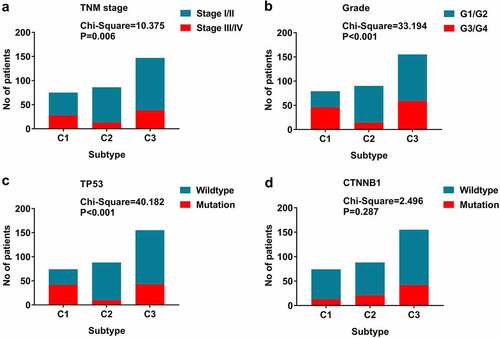
Figure 7. Survival prediction performance of the prognostic signature. (a)Kaplan-Meier curves generated based on median separation. Risk group separation based on median separation (b). Survival status of patients in different risk groups based on median separation (c). Receiver operating characteristic curves displayed the predicted performance in 1000 (d), 2000 (e) and 3000 days (f)
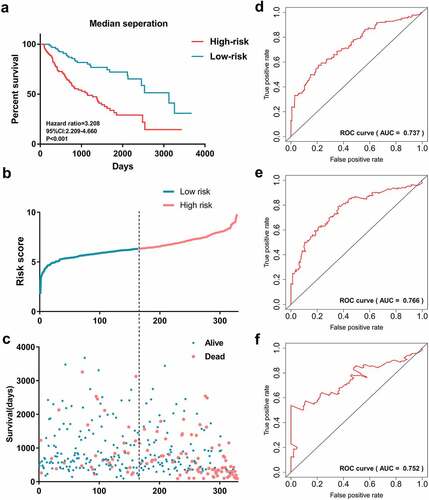
Figure 8. Landscape of mutations of splicing factors (SFs) in hepatocellular carcinoma. The most frequent mutated SFs in hepatocellular carcinoma
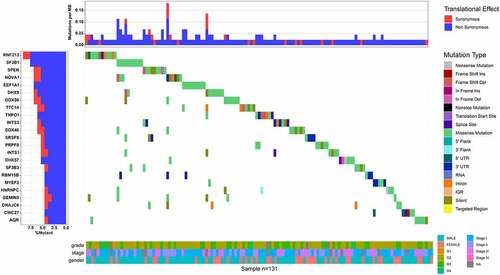
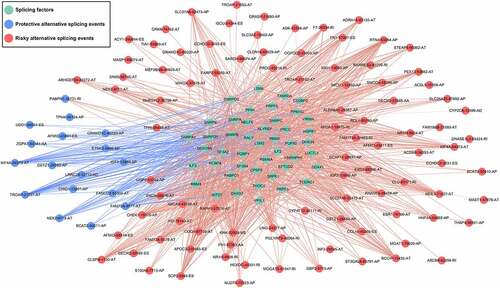
Figure 9. The most clinically relevant alternative splicing events in hepatocellular carcinoma
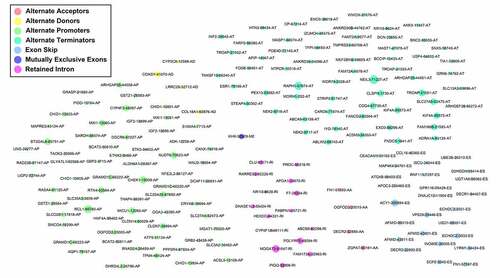
Figure 10. The interaction network of splicing factors. Correlation network between expression of survival AS factors and PSI values of AS genes generated using Cytoscape. Green dots were survival associated splicing factors. Blue/Red dots were favorable/adverse AS events. Red/blue lines represent positive/negative correlations between substances