
Figures & data
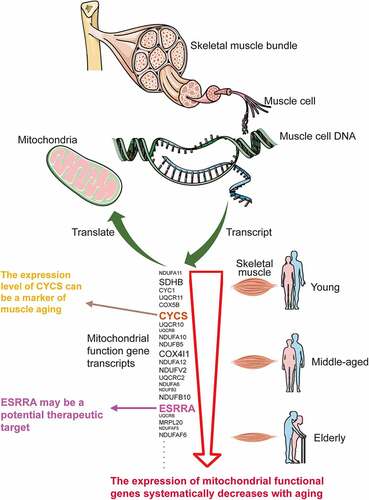
Figure 1. Protein-protein interaction (PPI) network construction of age-line-related genes (ALRGs) in GSE47881 dataset by the STRING database (https://string-db.org/). (a) The first Cluster proteins (MCODE Cluster score = 30.8) and (b) the second cluster proteins (MCODE Cluster score = 15.6) associated with mitochondrial function
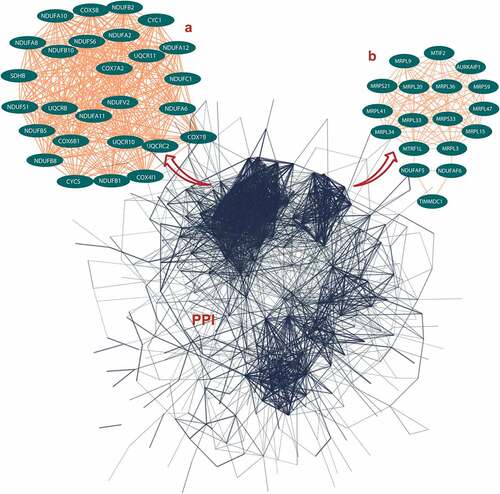
Figure 2. Protein-protein interaction (PPI) network construction of age-line-related genes (ALRGs) in GSE118825 dataset by the STRING database (https://string-db.org/). (a) The first Cluster proteins (MCODE Cluster score = 24.9) and (b) the second cluster proteins (MCODE Cluster score = 12) associated with mitochondrial function
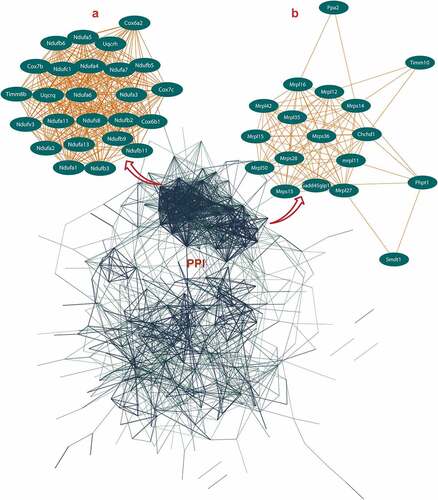
Figure 3. (a, b) Genes corresponding to the cluster proteins A and B in GSE47881 dataset decreased with age. (c) Heat map of the cluster genes in GSE47881 dataset
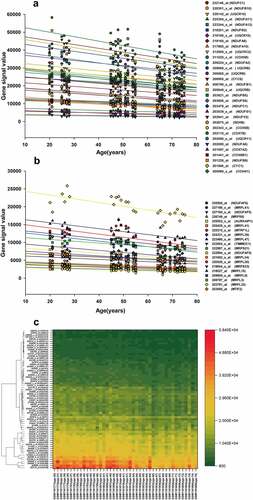
Figure 4. (a, b) Genes corresponding to the cluster proteins A and B in GSE118825 dataset decreased with age. (c) Heat map of the cluster genes in GSE118825 dataset
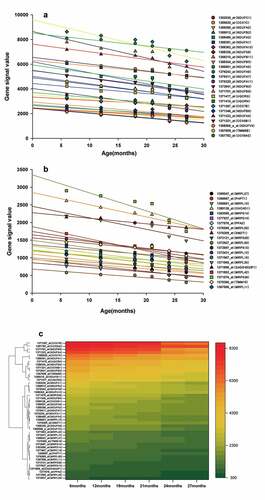
Figure 5. Gene Set Enrichment Analysis (GSEA) of the ALRGs in GSE47881 dataset links with mitochondrial biological processes like mitochondrial termination translation, oxidative phosphorylation, cellular respiratory, electron transfer. Note: Different colored balls represent different signaling pathways, different ball size represents the number of genes enriched in the pathway, and different colors in the same ball represent the same genes in two biological processes
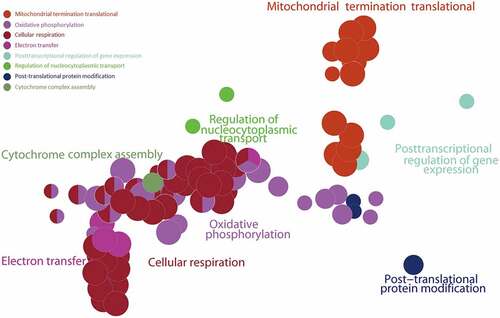
Figure 6. Gene Set Enrichment Analysis (GSEA) of the ALRGs in GSE118825 dataset links with mitochondrial biological processes like mitochondrial respiratory chain complex assembly, generation of precursor metabolites and energy, oxidative phosphorylation, NADH dehydrogenase activity. Note: Different colored balls represent different signaling pathways, different ball size represents the number of genes enriched in the pathway, and different colors in the same ball represent the same genes in in two biological processes
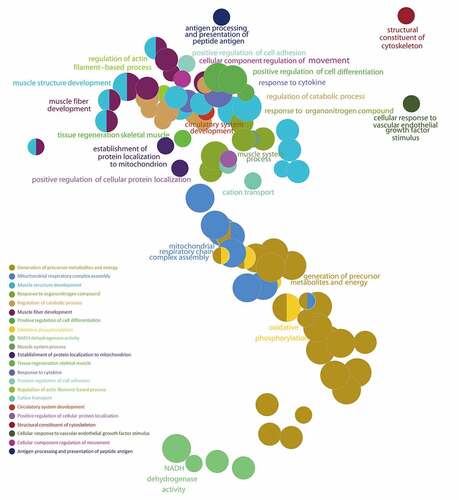
Figure 7. (a) Molecular Function gene sets of the ALRGs in GSE47881 and GSE118825 mainly involved electron transfer activity, NADH dehydrogenase activity, ubiquinol-cytochrome C reductase activity. (b) Celluar components largely involved the mitochondria complex. (c) Pathways analysis primarily involved cellular respiration, oxidative phosphorylation, and electron transport
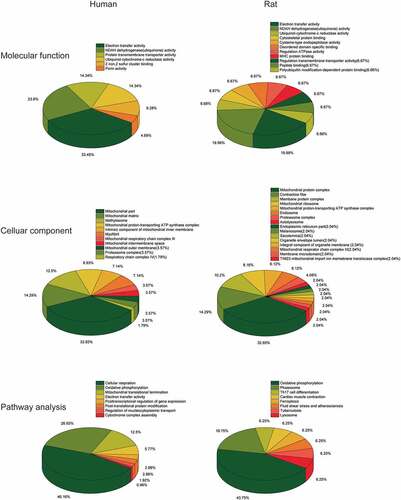
Figure 8. CYCS is the hub gene of ALRGs in human skeletal muscle. (a) The candidate hub gene of ALRGs in GSE47881 dataset by nine topological algorithms from CytoHubba of Cytoscape software. (b) A scatter plot between old/young ratio of average relative expression of CYCS (208905_at, 229415_at and 244546_at transcripts) and P-value significance in different GSE skeletal muscle datasets. (c) Meta-analysis of multiple studies on the difference of expression values of 208905_at transcript in skeletal muscle between old and young people. (d) The 208905_at transcript expression takes the largest proportion of CYCS transcripts in each GSE skeletal muscle dataset. (e) ROC curves for relative values of 208905_at expression between old and young people based on the GSE skeletal muscle datasets
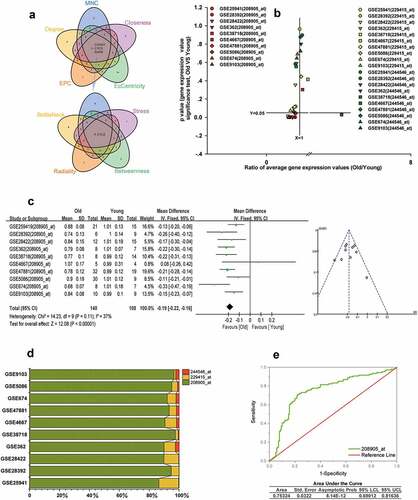
Figure 9. ESRRA is a key transcription factor of ALRGs in human skeletal muscle. (a) The potential transcription factors in the PPI network of ALRGs in GSE47881 dataset by the iRegulon plugin of Cytoscape. (b) The co-expression network of ESRRA by the Coexpedia internet tool (http://www.coexpedia.org). (c) Pathway enrichment analysis of the co-expression network. (d) The prediction of ESRRA target genes from the MSigDB and GeneSigDB databases
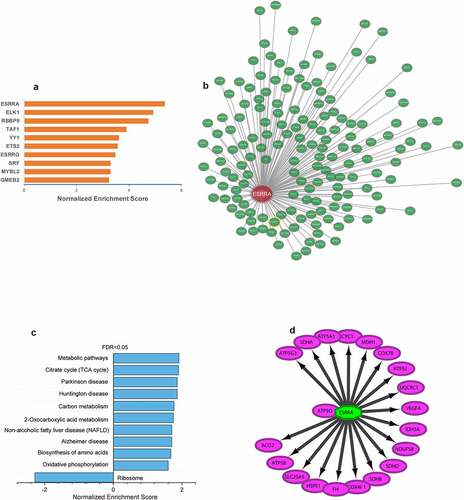
Figure 10. Decreased expression of ESRRA in skeletal muscle of elderly people. (a) A scatter plot between old/young ratio of average relative expression of ESRRA (1487_at and 203193_at transcripts) and P-value significance in different GSE skeletal muscle datasets. (b-c) Meta-analysis of multiple studies on the difference of expression values of 1487_at (b) and 203193_at (c) transcript in skeletal muscle between old and young people
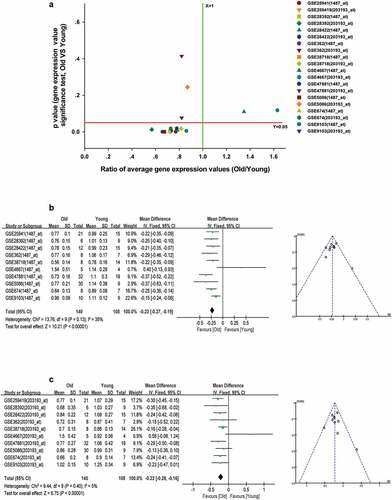
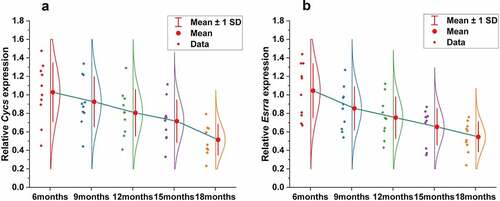
Figure 11. Decreased expression of CYCS and ESRRA in skeletal muscle with aging by qRT-PCR. Gene expression of CYCS (a) and ESRRA (b) in mice is significantly different across ages (6 months, 9 months, 12 months, 15 months and 18 months), and decreased gradually with aging
Data availability statement
The datasets presented in this study can be found in the GEO database (https://www.ncbi.nlm.nih.gov/geo/).