Figures & data
Figure 1. Confirmation of Notch2 overexpression in NPC cells. (a) Schematic of the recombinant plasmid H9511 containing Notch2 cDNA. (b) Relative protein expression of Notch2 in the oeNotch2 group compared to the control group. The plotted data are shown as the means±SD of three independent experiments, and the differences between the control and oeNotch2 groups were compared by using Student’s t-test (**P < 0.01)
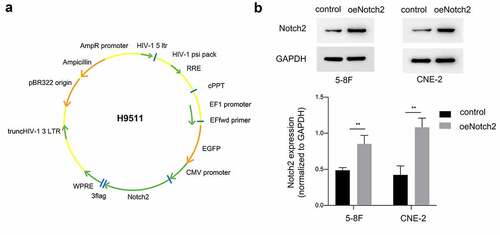
Figure 2. Overexpression of Notch2 enhances the radiosensitivity of NPC cells. (a, b) In 5–8 F and CNE-2 cells, the viability of the control, oeNotch2, IR+control and IR+oeNotch2 groups was detected by the CCK-8 assay. (c) In 5–8 F and CNE-2 cells, the surviving fractions in the oeNotch2 and control groups after radiation at different doses (2, 4, and 6 Gy) are shown. The plotted data are shown as the means±SD of three independent experiments, and the differences between the IR+oeNotch2 and the control, oeNotch2, or IR+control groups were compared by using Student’s t-test. (*P < 0.05; **P < 0.01; ***P < 0.001)
Table 1. Radiobiological parameters fit to the single-hit multitarget model
Figure 3. Overexpression of Notch2 enhances radiation-induced G2/M-phase arrest and apoptosis in NPC cells. (a, b) Flow cytometric analysis was performed to detect the percentage of 5–8 F and CNE-2 cells in G2/M phase, which is relatively radiation sensitive. (c, d) Flow cytometric analysis was performed to detect the apoptosis rate in 5–8 F and CNE-2 cells. The plotted data are shown as the means±SD of three independent experiments, and the differences between the IR+oeNotch2 group and the control, oeNotch2, or IR+control groups were compared by using Student’s t-test (**P < 0.01)
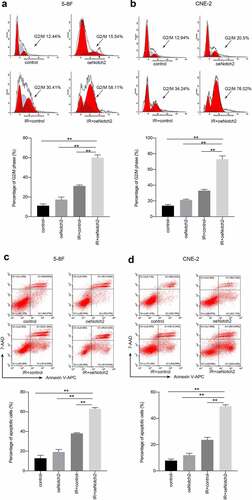
Figure 4. Overexpression of Notch2 alters the expression of proteins related to DNA damage, apoptosis and cell cycle progression in NPC cells. (a, b) Western blot analysis of BAX, Bcl-2, γH2AX and Cyclin D1 expression in the control, oeNotch2, IR+control and IR+oeNotch2 groups. Quantification of BAX, Bcl-2, γH2AX and Cyclin D1 levels is presented as bar graphs. GAPDH was used as a loading control. The plotted data are shown as the means±SD of three independent experiments, and the differences between the IR+oeNotch2 group and the control, oeNotch2, or IR+control groups were compared by using Student’s t-test (*P < 0.05; **P < 0.01; ***P < 0.001)
Figure 5. Overexpression of Notch2 inhibits the AKT/mTOR signaling pathway in NPC cells. (a, b) Western blot analysis of AKT, p-AKT, mTOR and p-mTOR expression levels in the control, oeNotch2, IR+control and IR+oeNotch2 groups. Quantification of the AKT, p-AKT, mTOR and p-mTOR is presented in bar graphs. GAPDH was used as a loading control. The plotted data are shown as the means±SD of three independent experiments, and the differences between the IR+oeNotch2 group and the control, oeNotch2. or IR+control groups were compared by using Student’s t-test (ns, P > 0.05; *P < 0.05; **P < 0.01; ***P < 0.001)