Figures & data
Table 1. Correlation between miR-101-3p or CUL4B and clinicopathological characteristics of prostate cancer
Table 2. Primer sequences for RT-qPCR
Figure 1. CUL4B as well as miR-101-3p expression among Pca tissues plus cells (a) MiR-101-3p expression among Pca tissues was analyzed through qRT-PCR. (b) The miR-101-3p expression from normal prostatic epithelial cells was measured through qRT-PCR. (c) Kaplan–Meier was used to analyze the relationship between miR-101-3p expression and the survival and prognosis of esophageal cancer patients. (d) Kaplan–Meier was used to analyze the relationship between CUL4B expression and the survival and prognosis of esophageal cancer patients. (e) miRNA expression of CUL4B from Pca tissues was measured through qRT-PCR. (f) mRNA expression of CUL4B in normal prostatic epithelial cells and Pca cells were tested through qRT-PCR. **P < 0.01, ***P < 0.001
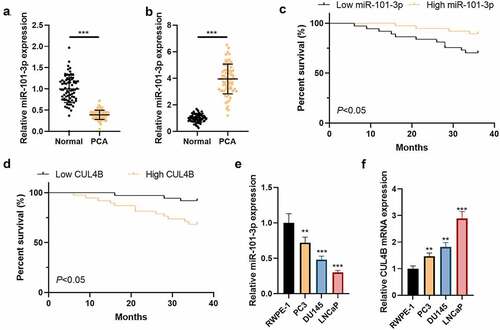
Figure 2. miR-101-3p has combination correlation with CUL4B. (a) We found combination sites between CUL4B and miR-101-3p. (b–c) Dual-luciferase reporter experiments showed that CUL4B from LNCaP cells and PC-3 cells was aimed by miR-101-3p. ***P < 0.001
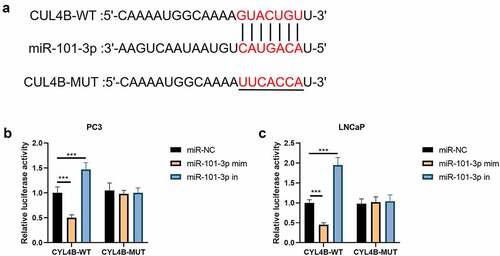
Figure 3. miR-101-3p effects on CUL4B in human Pca cells (a–b) qRT-PCR was adopted to detect CUL4B and miR-101-3p expression among LNCaP as well as PC3 cells. (c–d) Protein CUL4B that expressed in LNCaP as well as PC3 cells was estimated through WB. ***P < 0.001
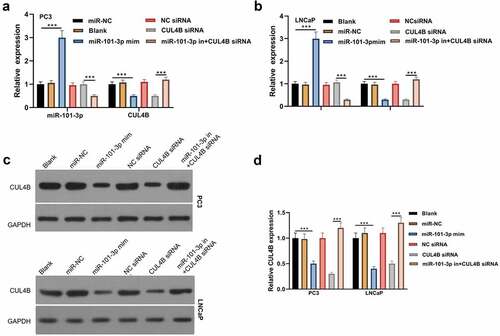
Figure 4. Pca cellular proliferation was suppressed through miR-101-3P aiming for CUL4B. (a–b) MTT approaches were used to detect LNCaP and PC3 cellular proliferation from different groups. C The inverted fluorescence microscope observed growth situation of LNCaP and PC3 cells. Cellular nuclei were dyed through DAPI staining (blue). Red dye meant that cells were proliferating. (d–e) PC3 cells were compared with LNCaP cells in terms of EDU positive index. The positive number in terms of EDU was shown in the form of the percentage number, which was a positive number/total cellular number in details. ***P < 0.001
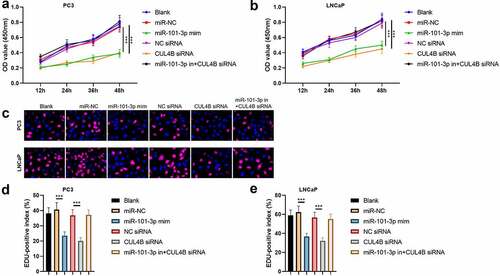
Figure 5. Cellular apoptosis situation in LNCaP and PC3 cells (a-d) We employed Annexin V-FITC/PI dye to display cellular apoptosis situation in LNCaP and PC3 cells. ***P < 0.001
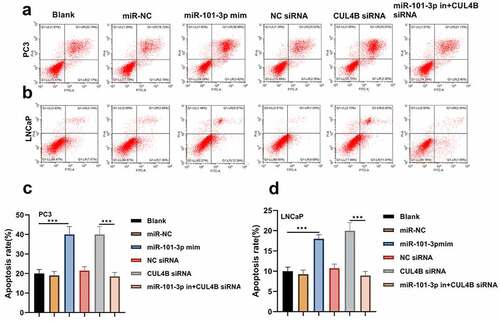
Figure 6. Western blotting approaches were adopted to detect proteins related to apoptosis (cleaved Caspase-3/Caspase-3, Bcl-2 and Bax) expression in LNCaP cells and PC3 cells. Noting: 1. the blank groups, 2. the miR-negative control groups, 3. the miR-101-3p simulation groups, 4. the Negative Control SiRNA groups 5. the siRNA of CUL4B groups 6. siRNA of CUL4B plus the inhibitors of miR-101-3p groups ***P < 0.001
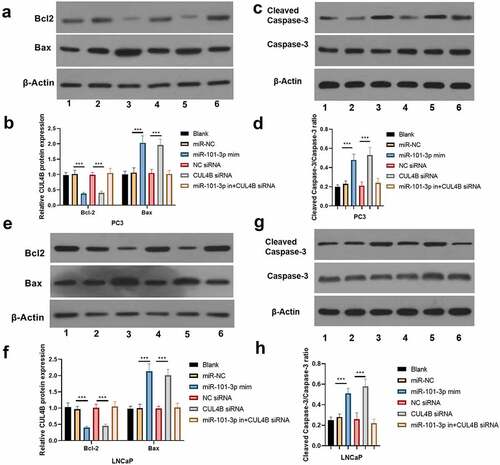
Figure 7. miR-101-3p inhibited Pca cellular migration through aiming for CUL4B. (a–c) The wound-healing experiments observed cellular migration in different groups. The closure rates (%) in scratch areas from different groups of LNCaP and PC3 cells were compared. ***P < 0.001
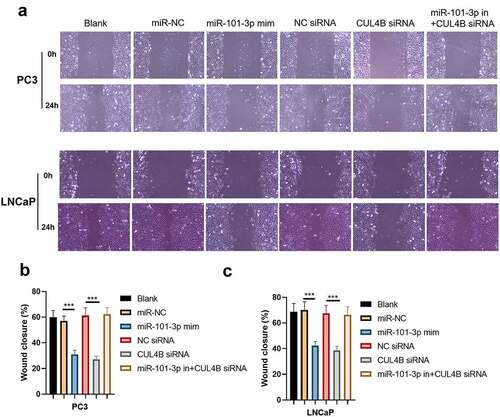
Figure 8. miR-101-3p suppressed Pca cellular invasion through aiming for CUL4B. (a–c) Transwell invasion experiments were used to observe invasion ability in LNCaP cells and PC3 cells. ***P < 0.001
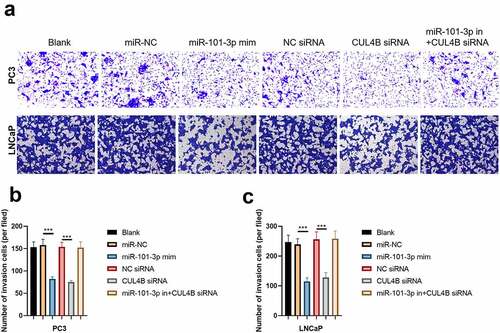
Figure 9. Western blotting methods were used to detect protein expression related to PI3K/AKT/mTOR signal in LNCaP as well as PC3 cells from different groups. Noting: 1. the blank groups, 2. the miR-negative control groups, 3. the miR-101-3p simulation groups, 4. the negative control SiRNA groups 5. the siRNA of CUL4B groups 6. siRNA of CUL4B plus the inhibitors of miR-101-3p groups ***P < 0.001
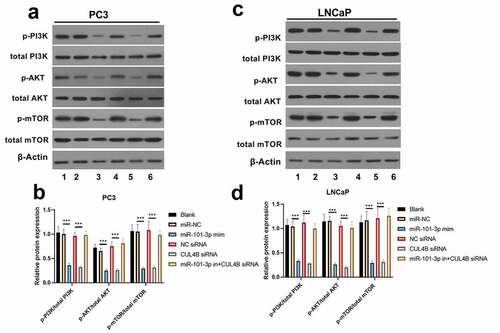
Figure 10. Verification of transfection efficiency of miR-101-3p and CUL4B. (a–b) qPCR to detect miR-101-3p and CUL4B expressions in PCA cells. (c–d) Western Blot to detect miR-101-3p and CUL4B expressions in PCA cells. ***P < 0.001
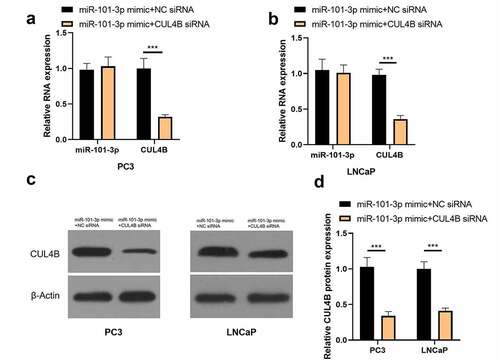
Figure 11. Inhibition of CUL4B further enhances the inhibitory effect of up-regulated miR-101-3p on PCA cell proliferation. (a–b) MTT approaches were used to detect LNCaP and PC3 cellular proliferation from different groups. C The inverted fluorescence microscope observed growth situation of LNCaP and PC3 cells. Cellular nuclei were dyed through DAPI staining (blue). Red dye meant that cells were proliferating. (d) PC3 cells were compared with LNCaP cells in terms of EDU positive index. The positive number in terms of EDU was shown in the form of the percentage number, which was a positive number/total cellular number in details. ***P < 0.001
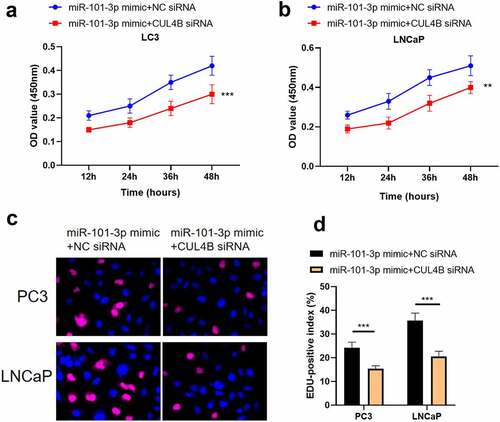
Figure 12. Inhibition of CUL4B further enhances the inhibitory effect of up-regulated miR-101-3p on PCA cell apoptosis. (a–b) We employed Annexin V-FITC/PI dye to display cellular apoptosis situation in LNCaP and PC3 cells. (c–f) Western blotting approaches were adopted to detect proteins related to apoptosis(Cleaved Caspase-3/Caspase-3, Bcl-2 and Bax) expression in LNCaP cells and PC3 cells.Noting:1. the miR-101-3p mimic+NC siRNA groups, 2. the miR-101-3p mimic+CUL4B siRNA groups,***P < 0.001
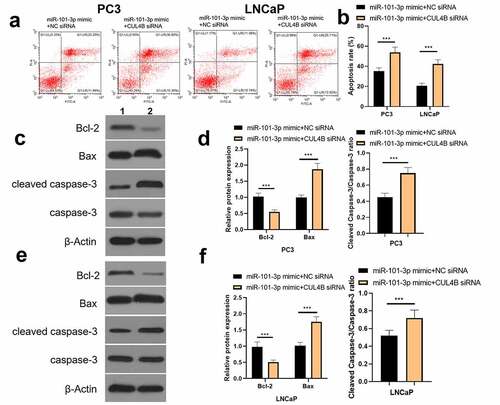
Figure 13. Inhibition of CUL4B further enhances the inhibitory effect of up-regulated miR-101-3p on PCA cell migration and invasion. (a–b) The wound-healing experiments observed cellular migration in different groups. The closure rates (%) in scratch areas from different groups of LNCaP and PC3 cells were compared. (c–d) Transwell invasion experiments were used to observe invasion ability in LNCaP cells and PC3 cells. ***P < 0.001
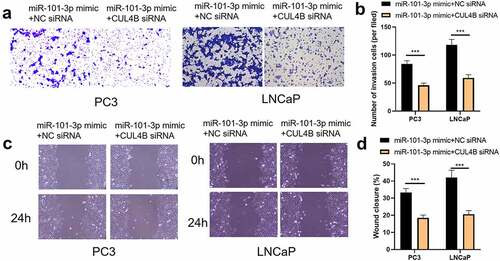
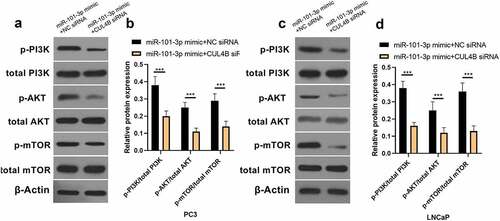
Figure 14. Western blotting methods were used to detect protein expression related to PI3K/AKT/mTOR signal in LNCaP as well as PC3 cells from different groups. ***P < 0.001