Figures & data
Figure 1. Work flow chart
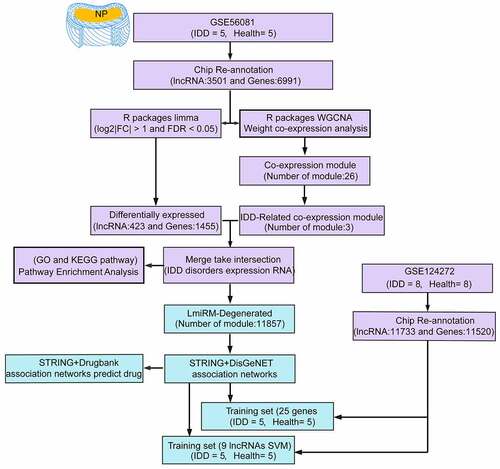
Table 1. Sample information for each dataset
Figure 2. Identification of differentially expressed genes. A: the expression distribution of protein coding genes in each sample in the GSE56081 dataset; B: the expression distribution of lncRNAs in each sample in the GSE56081 dataset; C: the protein coding genes in each sample in the GSE124272 dataset D: the expression distribution of lncRNAs in each sample in the GSE124272 data set; where red represents disease samples and blue represents healthy samples; E: GSE56081 data set protein coding gene difference volcano map, F: GSE56081 data set lncRNA Difference volcano map
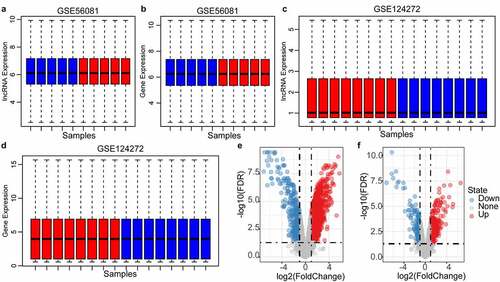
Figure 3. Weighted co-expression network construction and disease-related module identification, (AB) Determination of soft-thresholding power in the weighted gene co-expression network analysis (WGCNA). (a) Analysis of the scale-free fit index for various soft- thresholding powers (β). (b) Analysis of the mean connectivity for various soft-thresholding powers. (c) Dendrogram of all differentially expressed genes/lncRNAs clustered based on a dissimilarity measure (1-TOM). (d) Distribution of average gene significance and errors in the modules associated with the Degenerated. (e) The distribution of the feature vector of each module in the Degenerated and healthy control samples
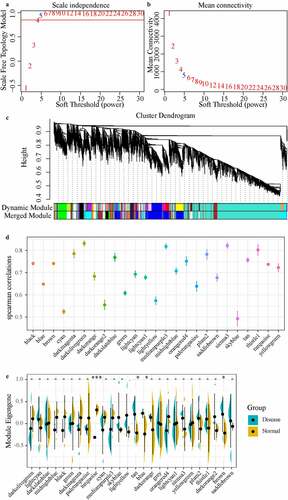
Figure 4. Functional enrichment analysis of disease-related modules. A: GO Term and KEGG Pathway statistics enriched by the three modules; B: Venn diagram of the intersection between enriched genes and lncRNAs of the three modules and differential genes and lncRNAs; C: the most significant enrichment of the brown module Top 10 KEGG Pathway. D: The most significant top 10 KEGG Pathway enriched by the turquoise module. Different colors indicate the significance of enrichment, and the size of the dot indicates the number of enriched genes
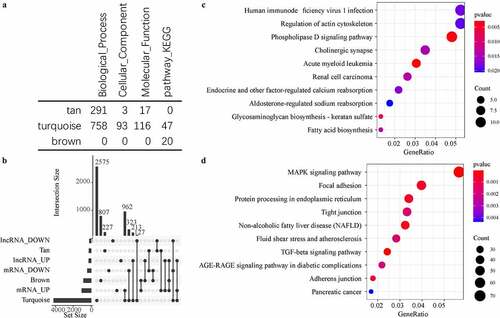
Figure 5. Identification of LmiRM-Degenerated and its role in intervertebral disc degeneration. A: Comparison of the correlation between lncRNA-mRNA in LmiRM-Degenerated and the correlation distribution of non-LmiRM-Degenerated lncRNA-mRNA; B: LmiRM-Degenerated Comparison of the fold of expression difference between the RNA and non-LmiRM-Degenerated differential RNA and non-differential RNA; C: the distribution of lncRNA and mRNA in LmiRM-Degenerated on the genome, the color of the inner circle heat map gradually changes from blue to red Represents the expression difference multiples from low to high; D: LmiRM-Degenerated enriched KEGG Pathway and gene relationship circle diagram, the right side is the pathway, different colors indicate different pathways, the left is the gene, and different colors indicate expression difference multiple
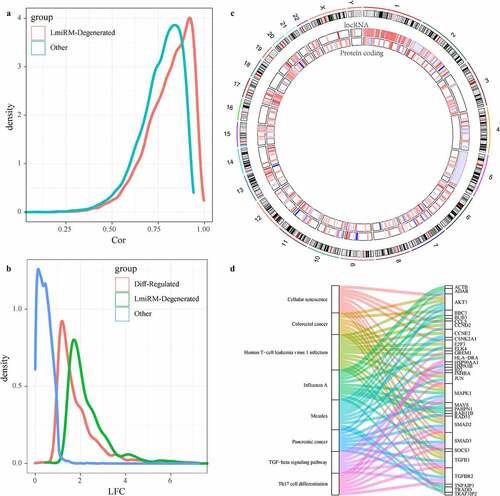
Figure 6. LmiRM-Degenerated analysis revealed biomarkers for the diagnosis and treatment of intervertebral disc degeneration. A: Disease genes in the interaction network between disease genes and LmiRM-Degenerateds genes-the shortest path distribution of disease genes and disease genes -LmiRM- The shortest path distribution between Degenerateds genes. B: Frequency statistics of lncRNAs that interact with disease-specific genes. The x-axis is the number of disease-specific genes corresponding to the lncRNA, and the y-axis is the frequency of lncRNA. C: The differential expression distribution of 25 disease-specific genes. D: The differential expression distribution of 9 disease-specific lncRNAs. E: The average shortest path distribution from the drug to the IDD-specific gene
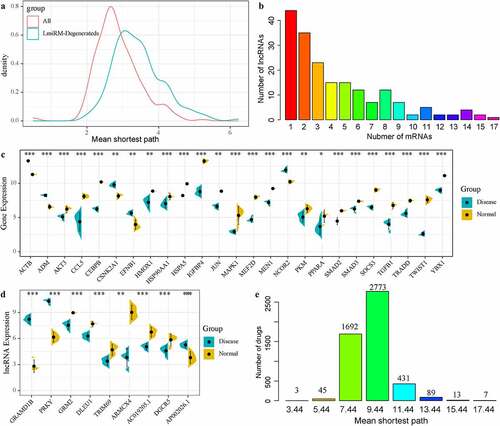
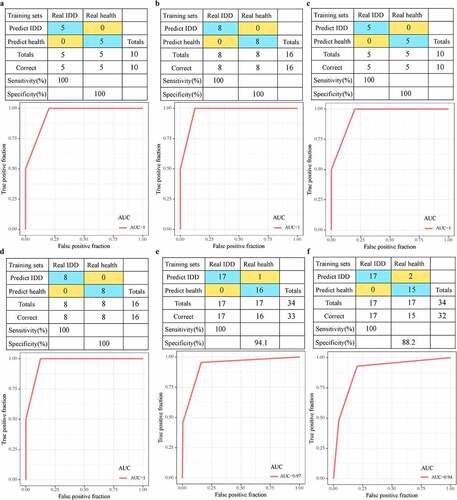
Figure 7. Advantages of diagnostic models. A: The classification results and ROC curve of the samples of the genetic diagnosis model in the training dataset; B: The classification results and ROC curve of the samples of the genetic diagnosis model in the validation dataset; C: The classification results and ROC curve of the lncRNA diagnosis model in the training dataset; D: The classification results and ROC curve classified by the lncRNA diagnosis model in the validation dataset. E: The classification results and ROC curve of the samples of the genetic diagnosis diagnosis model in the GSE150408 dataset. F: The classification results and ROC curve of the samples of the lncRNA diagnosis model in the GSE150408 dataset