
Figures & data
Figure 1. HPLC chromatogram of delphinidin-3-sambubioside (Dp3-Sam)
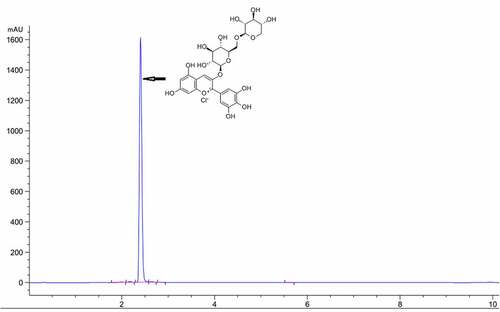
Table 1. The formula of the experiment diets (%)
Table 2. Primer sequences for quantitative real-time RNA
Figure 2. Beneficial effects of delphinidin-3-sambubioside (Dp3-Sam) on high fat diet (HFD)-induced obese rats. (a) final weight; (b) body weight gain; (c) food intake; (d) liver index; (e) abdominal fat; (f) visceral fat; (g) fecal lipids, and (h) food efficiency ratio. Data are reported as mean ± SEM. * P < 0.05, ** P < 0.01, no significant difference (ns)
Figure 3. Treatment with delphinidin-3-sambubioside (Dp3-Sam) alleviates lipid deposition in HFD rats. Representative images of hepatic tissue Oil Red O staining of each group, black arrows indicated lipid droplet. Scale bar, 50 µm
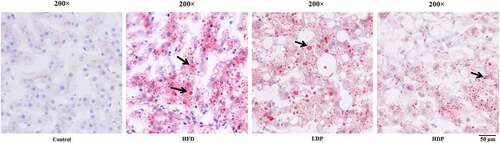
Figure 4. Effect of delphinidin-3-sambubioside (Dp3-Sam) on serum lipid profile (a), and hepatic lipid profile (b) in the high-fat diet (HFD)-induced obese rats. Low-density lipoprotein cholesterol (LDL-C), high-density lipoprotein cholesterol (HDL-C), triacylglycerol (TG), and total cholesterol (TC). Data are reported as mean ± SEM. * P < 0.05, ** P < 0.01, no significant difference (ns)
Figure 5. Effect of delphinidin-3-sambubioside (Dp3-Sam) on liver expression of ACC (a), FAS (b), SREBP-1 C (c), HMGCR (d), CYP7A1 (e), CPT1 (f), ACOX (g), and PPARα (h) in high fat diet (HFD)-induced obese rats. Data are reported as mean ± SEM. * P < 0.05, ** P < 0.01, no significant difference (ns)
Figure 6. Effect of delphinidin-3-sambubioside (Dp3-Sam) on the expression of AMPK in high fat diet (HFD)-induced obese rats. The expression of AMPK and pAMPK in hepatic tissues were measured by western blot. Data are reported as mean ± SEM. * P < 0.05, ** P < 0.01, no significant difference (ns)
Figure 7. Effect of delphinidin-3-sambubioside (Dp3-Sam) on cell viability and TG levels in oleic acid-treated HepG2 cells. (a) Cell viability was measured by MTT. (b) The levels of TG in HepG2 cells were assayed. HepG2 cells were stimulated with oleic acid (0 or 0.2 mM) and treated with different concentrations of DP (0–500 µg/ml) for 24 h. Data are reported as the mean ± SEM. * P < 0.05, ** P < 0.01 vs. oleic acid group
Figure 8. Effect of delphinidin-3-sambubioside (Dp3-Sam) on lipid accumulation in oleic acid-treated HepG2 cells. (a) Lipid accumulation was colorimetrically assayed at 510 nm. (b) Observing the Oil Red O stained cells by a microscope. Scale bar, 50 µm. HepG2 cells were stimulated with oleic acid (0 or 0.2 mM) and treated with different concentrations of DP (100 or 200 µg/ml) for 24 h. Data are reported as the mean ± SEM. * P < 0.05, ** P < 0.01 vs. oleic acid group
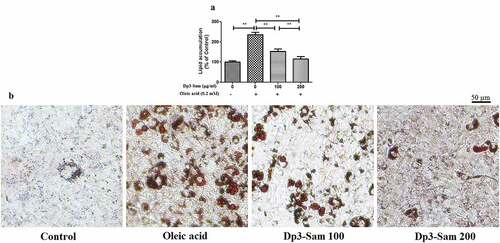
Figure 9. Effect of delphinidin-3-sambubioside (Dp3-Sam) on lipid metabolism in HepG2 cells. HepG2 cells were stimulated with oleic acid (0 or 0.2 mM) and treated with different concentrations of DP (100 or 200 µg/ml) for 24 h. The mRNA levels of FASN (a), SREBP-1 c (b), CPT1 (c), and PPARα (d) were measured by qRT-PCR. Data are reported as mean ± SEM. * P < 0.05, ** P < 0.01, no significant difference (ns)
Data availability statement
The data that support the findings of this study are available from the corresponding author, upon reasonable request.