Figures & data
Figure 1. The expression pattern of FAM83D in TCGA. (a) differential analysis of FAM83D. (b) Paired differences in TCGA
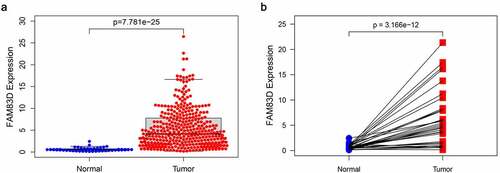
Figure 2. FAM83D expression associated survival analysis. (a) TCGA. (b) Kaplan meier plotter
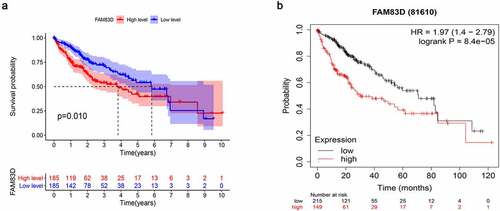
Table 1. Logistic regression of FAM83D expression and clinical pathological characteristics
Table 2. Univariate and multivariate analysis of the relationship between FAM83D expression and overall survival among HCC patients
Figure 3. Association of FAM83D expression with clinical features. (a) Gender. (b) Age. (c) Lymphatic metastasis. (d) Distant metastasis. (e) T classification. (f) AJCC stage. (g) Grade
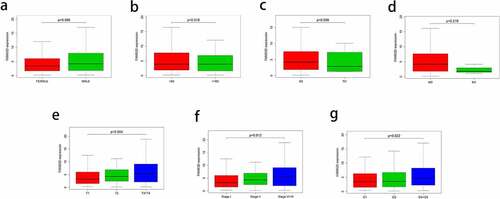
Figure 4. Enrichment plots from gene set enrichment analysis (GSEA)
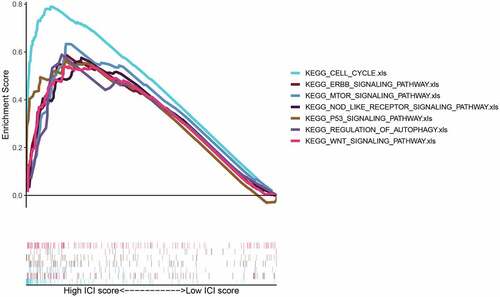
Figure 5. Associations between FAM83D and infiltrating immune cells in TCGA LIHC cohort
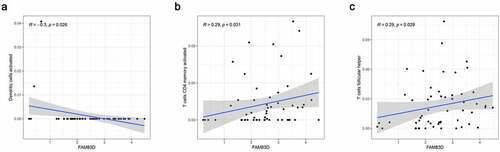
Figure 6. Association between FAM83D expression and immune cell infiltration levels via TISIDB network tool. The black asterisks in the correlation heatmap indicated immune cell types significantly associated with FAM83D expression levels in TCGA. *P < 0.05; **P < 0.01, ***P < 0.005
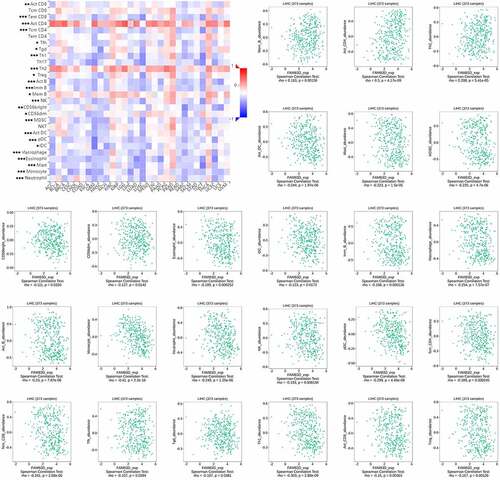
Figure 7. Identification and analysis of immunomodulators associated with the FAM83D gene. (a) The heatmaps of correlation between the immunoinhibitors (left panel), immunostimulators (right panel) and the FAM83D gene in LIHC. (b) Protein–protein network of 32 FAM83D-associated immunomodulators and 50 closely related genes in LIHC, produced by the STRING online server. (c) GO annotation of 32 FAM83D-associated immunomodulators and 50 closely connected genes in LIHC. (d) KEGG pathway analysis of the above mentioned 82 genes
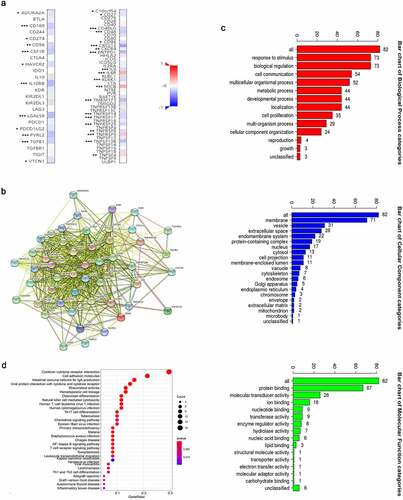
Figure 8. The development of prognostic gene signatures based on 82 FAM83D-associated immunomodulators. (a) Univariate COX regression of FAM83D-associated immunomodulators. (b) The hazard ratios and coefficient of FAM83D-associated prognostic genes of multivariate COX regression
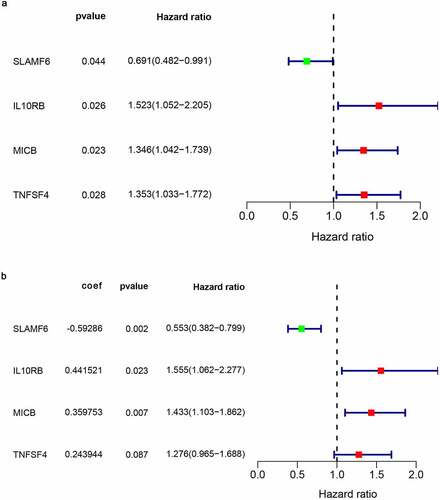
Figure 9. Establishment and internal validation of prognostic model based on risk-score of FAM83D-associated prognostic immunomodulators. (a) Survival curves of the high and low risk group of the TCGA train set. (b) Time-dependent ROC curves of FAM83D-associated prognostic model of the TCGA train set. (c) Survival curves of the high and low-risk group of the TCGA test set. (d) Time-dependent ROC curves of FAM83D-associated prognostic model of the TCGA test set
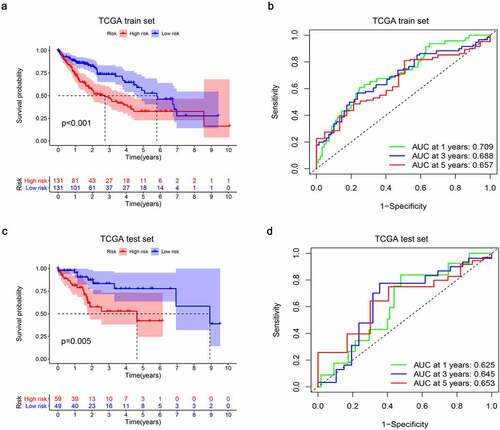
Figure 10. Characteristics of the FAM83D-associated prognostic signature in the TCGA dataset. The dotted line is the optimal cut-of value for dividing HCC patients into high and low risk groups. (a) The distribution of risk-score and the survival status of HCC patients in train set. (b) Heatmap of the FAM83D-associated prognostic signature expression profiles between the high and low-risk groups in train set. (c) The distribution of risk-score and the survival status of HCC patients in test set. (d) Heatmap of the FAM83D-associated prognostic signature expression profiles between the high and low-risk groups in test set
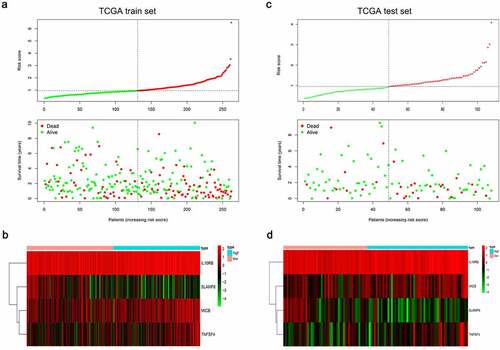
Figure 11. The prognostic value of the FAM83D-associated prognostic signature in the TCGA dataset. (a) Univariate COX analysis of risk-score and clinical characteristics. (b) Multivariate COX analysis of risk-score and clinical characteristics
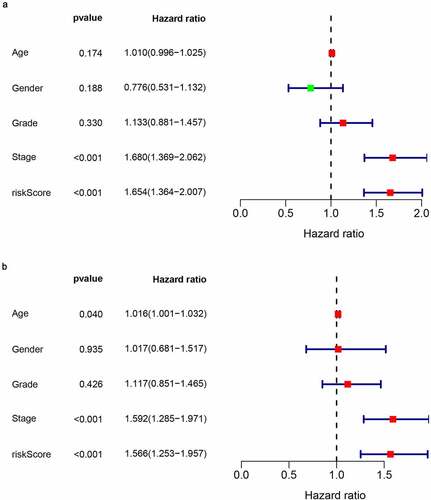
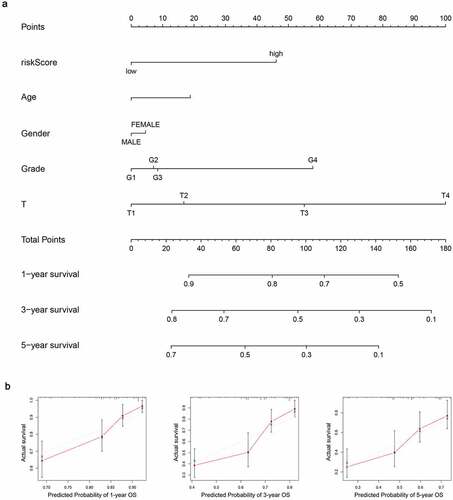
Figure 12. Establishment of the prognostic nomogram with the inclusion of the risk-score. (a) A nomogram for predicting 1-, 3- and 5-year survival possibilities of individual HCC patients. (b) The calibration curve of 1-, 3- and 5-year survival of HCC patients. The dashed line represented a perfect uniformity between nomogram-predicted and real possibilities.< 0.05