Figures & data
Figure 1. Identification of differentially expressed miRNAs (DEMs) and mRNAs (DEGs). (a) Heatmap of DEMs among the control and GDM groups. (b) Heatmap of DEGs among the control and GDM groups
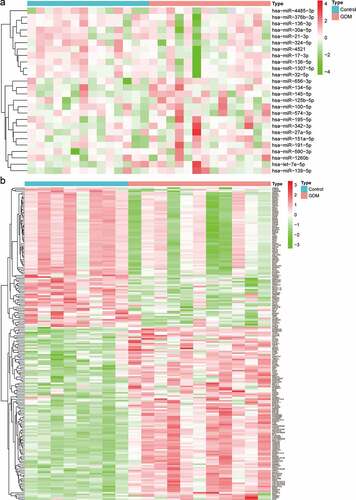
Figure 2. GO functional annotation and KEGG pathway analysis. (a) The top 5 enriched GO functional annotations of upregulated DEGs. (b) The top 5 enriched GO functional annotations of downregulated DEGs. (c) The top 5 enriched KEGG pathways of upregulated DEGs. (d) The top 5 enriched KEGG pathways of downregulated DEGs
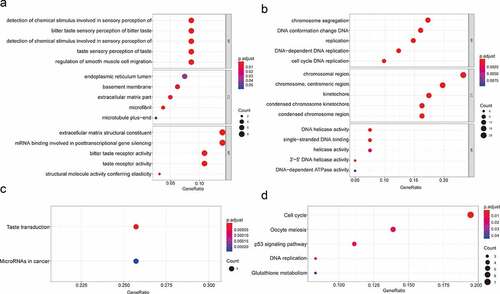
Figure 3. miRNA-mRNA regulatory network. (a) Red triangles represent upregulated miRNAs, green triangles represent downregulated miRNAs, red ovals represent upregulated mRNAs, green ovals represent downregulated mRNAs and lines represent the interactions between DEMs and DEGs. (b) Venn diagram showing overlapping genes between target genes and DEGs. (c) Top 10 hub miRNAs with the highest degree of connectivity
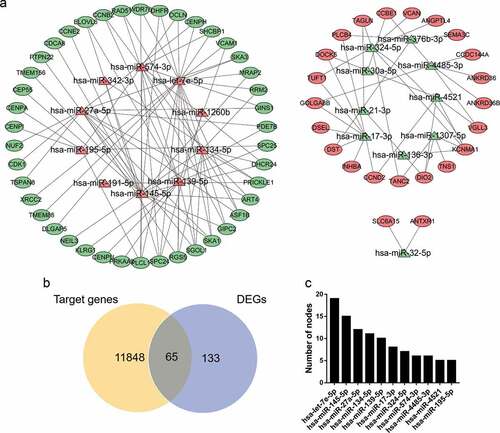
Figure 4. PPI network and module analysis. (a) PPI network of DEGs. The red ovals represent upregulated genes, and the green ovals represent downregulated genes. (b) Top 10 hub genes with the highest degree of connectivity
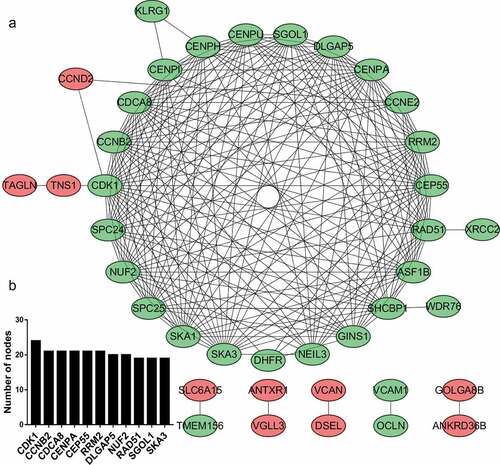
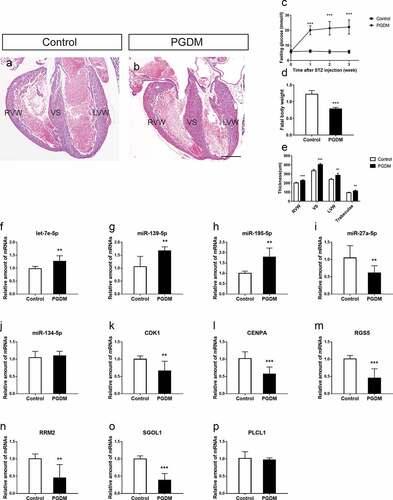
Figure 5. Validation of hub miRNAs and genes in the fetal heart of the control and PGDM groups. (a-b) H&E staining of E18.5 mouse heart vertical sections in the control (a) and PGDM (b) groups. (c) The detection of mouse maternal glucose blood in weeks 0–3. (d) The weight of fetuses in the control and PGDM groups at E18.5. (e) Quantification of the thicknesses of the RVW, VS, LVW and trabeculae of mouse hearts in the control and PGDM groups at E18.5. (f-p) Validation of hub miRNAs and genes in the fetal hearts of the control and PGDM groups using quantitative real-time PCR. Scale bars = 400 μm. *p < 0.05, **p < 0.01, ***p < 0.001