
Figures & data
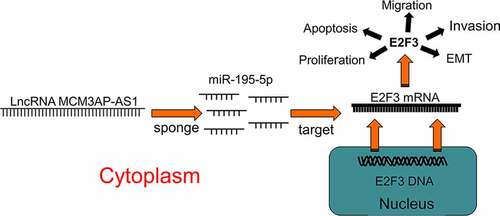
Table 1. Sequences used for qRT-PCR
Table 2. Correlation between clinicopathological features and expression of MCM3AP-AS1 in NSCLC
Figure 1. Expression of MCM3AP-AS1, miR-195-5p and E2F3 in NSCLC
(a) Analysis of MCM3AP-AS1 expression in NSCLC tissues (LUAD: n = 483; LUSC: n = 486) and non-cancerous tissues (N = 50) was conducted using the online database GEPIA (Match TCGA normal data). (b) Kaplan–Meier plotter database was used to conduct Kaplan–Meier analysis of the overall survival time of patients with NSCLC with high (n = 565) and low (n = 579) MCM3AP-AS1 expression levels (Affy ID: 232740_at; the samples were divided into high and low expression groups according to the median value of MCM3AP-AS1 expression). (c) qRT-PCR was performed to detect MCM3AP-AS1 expressions in 63 cases of NSCLC tissues and adjacent tissues. (d) qRT-PCR was performed to detect miR-195-5p expressions in 63 cases of NSCLC tissues and adjacent tissues. (e) qRT-PCR was performed to detect E2F3 mRNA expressions in 63 cases of NSCLC tissues and adjacent tissues. (f–h) Pearson’s correlation analysis was performed to assess the correlations among MCM3AP-AS1, miR-195-5p and E2F3 mRNA in NSCLC tissues.
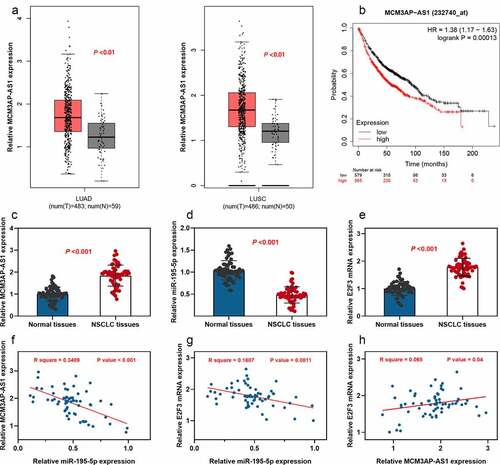
Figure 2. MCM3AP-AS1 was specifically regulated by miR-195-5p
(a) MCM3AP-AS1 expressions in BEAS-2B cells and NSCLC cells were measured by qRT-PCR. (b) Subcellular localization of MCM3AP-AS1 in A549 and H226 was assessed by qRT-PCR after nuclear–cytoplasm fractionation. (c) MiR-195-5p mimics or miR-195-5p inhibitors were transfected into A549 and H226 cells, respectively, and the transfection efficiency was examined by qRT-PCR. (d) The schematic map of the MCM3AP-AS1 WT and MCM3AP-AS1 MUT binding sites for miR-195-5p, which was predicted by LncBase Predicted v.2 (Score: 0.947). (e) MCM3AP-AS1-WT (WT1, WT2 and WT3) or MCM3AP-AS1-MUT (MUT1, MUT2 and MUT3) was co-transfected into HEK-293 T cells with miR-195-5p mimics or miR-195-5p inhibitors, and the relative luciferase activity was measured. (f) Transfection efficiency of MCM3AP-AS1 overexpression plasmids, sh-MCM3AP-AS1#1 or sh-MCM3AP-AS1#2 was detected by qRT-PCR. (g) The interaction between MCM3AP-AS1 and miR-195-5p in A549 and H226 cells was analyzed by RIP experiment. (h) Effect of MCM3AP-AS1 knockdown and overexpression on miR-195-5p expression in A549 and H226 cells was detected by qRT-PCR. All of the experiments were performed in triplicate. ** P < 0.01 and *** P < 0.001.
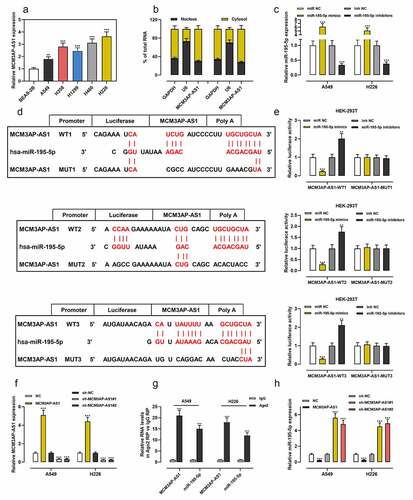
Figure 3. Effect of MCM3AP-AS1 and miR-195-5p on A549 and H226 cells proliferation and apoptosis
(a) MCM3AP-AS1 overexpressing plasmid and miR-195-5p mimics, sh-MCM3AP-AS1#1 and miR-195-5p inhibitors were co-transfected into A549 and H226 cells, respectively. qRT-PCR was used to detect transfection efficiency. (b) After the transfection, CCK-8 method was applied to detect the cell viability of A549 and H226 cells. (c–d) After the transfection, EdU assay was utilized to detect the proliferation of A549 and H226 cells. (e–f) After the transfection, Western blot was employed to detect the Bax and Bcl-2 expressions. All of the experiments were performed in triplicate. *P < 0.05, **P < 0.01 and *** P < 0.001.
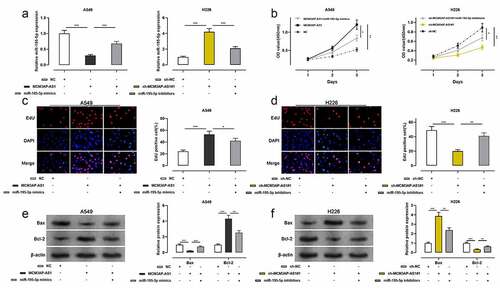
Figure 4. Effect of MCM3AP-AS1 on NSCLC cell migration and invasion
(a–d) MCM3AP-AS1 overexpressing plasmid and miR-195-5p mimics, sh-MCM3AP-AS1#1 and miR-195-5p inhibitors were co-transfected into A549 and H226 cells, respectively. Transwell experiment was performed to detect the migration and invasion of A549 and H226 cells. (e–f) MCM3AP-AS1 overexpressing plasmid and miR-195-5p mimics, sh-MCM3AP-AS1#1 and miR-195-5p inhibitors were co-transfected into A549 and H226 cells, respectively. Western blot was conducted to detect the expression of E-cadherin and N-cadherin in A549 and H226 cells. All of the experiments were performed in triplicate. ** P < 0.01, *** P < 0.001.
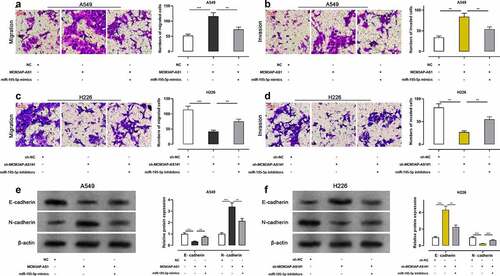
Figure 5. MCM3AP-AS1 up-regulated E2F3 expression by adsorbing miR-195-5p
(a–b) The schematic map of the E2F3 3ʹUTR WT and E2F3 3ʹUTR MUT binding site for miR-195-5p, which was predicted by TargetScan database (Context score percentile: 95). (c) E2F3 3ʹUTR-WT or E2F3 3ʹUTR-MUT was co-transfected into HEK-293 T cells with miR-195-5p mimics or miR-195-5p inhibitors, and the relative luciferase activity was measured. (d–e) MCM3AP-AS1 overexpressing plasmid and miR-195-5p mimics, sh-MCM3AP-AS1#1 and miR-195-5p inhibitors were co-transfected into A549 and H226 cells, respectively. qRT-PCR and Western blot were used to detect the expression of E2F3 in NSCLC cells. All of the experiments were performed in triplicate. ** P < 0.01, *** P < 0.001.
Supplemental material
Supplemental Material
Download ()Data availability statement
The data used to support the findings of this study are available from the corresponding author upon request.