Figures & data
Table 1. The 9 EMT-related lncRNAs identified from the lasso cox regression in TCGA dataset
Figure 1. Risk signature consisting of nine EMT-related lncRNAs. (a, b) Inclusion criteria for the nine EMT-related lncRNAs and their constants; the optimal penalty parameter β has been selected for a minimum 10-fold cross-validation of the training set. (c) Seven EMT-related lncRNAs. (d, e) Kaplan–Meier curves for OS in patients in TCGA (high risk: n = 299, low risk: n = 298) and the CGGA (high risk: n = 254, low risk: n = 254) datasets assigned to high-risk and low-risk glioma groups based on the median risk score. (f) Heatmap of the nine EMT-related lncRNAs in low-risk and high-risk glioma. The distribution of clinicopathological features is compared between the low-risk and high-risk groups. ns P > 0.05, * P < 0.05, ** P < 0.01, and *** P < 0.001
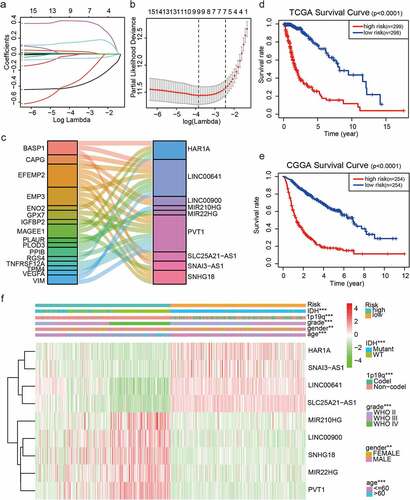
Figure 2. Distribution of risk scores, OS, and gene expression in TCGA and the CGGA datasets. (a, b) Distribution of risk scores and OS. (c) Heat map of the expression of nine EMT-related lncRNAs in low- and high-risk groups. Rows and columns show lncRNAs and patients, respectively
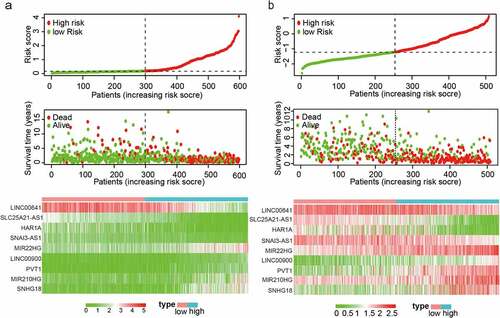
Figure 3. Expression of nine EMT-related lncRNAs according to tumor grade and risk group. ns P > 0.05, * P < 0.05, ** P < 0.01, and *** P < 0.001
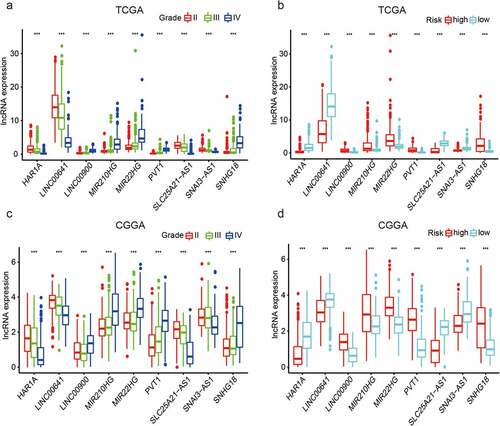
Figure 4. Predictive efficiency of the nine-EMT-related lncRNA signature. (a, b) Association between WHO grade, age, 1p19q codeletion status, IDH mutation status, and survival rate. (c–f) Univariate and multivariate Cox regression analyses of the association between clinicopathological factors (including risk score) and OS of patients in TCGA and the CGGA datasets
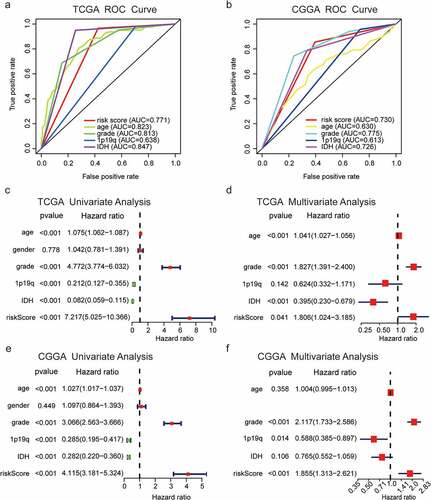
Figure 5. Distinct EMT status in patients with low-risk and high-risk glioma. (a) PCA between the low-risk and high-risk groups based on total gene expression profiles. (b) PCA between low-risk and high-risk groups based on EMT-related genes. (c, d) PCA between low-risk and high-risk groups based on all candidate EMT-related lncRNAs and the nine identified EMT-related lncRNAs. (e, f) GO and KEGG pathway enrichment analyses of DEGs in low-risk and high-risk groups. (g) Significant enrichment of EMT-associated functions in the high-risk group, as determined by GSEA
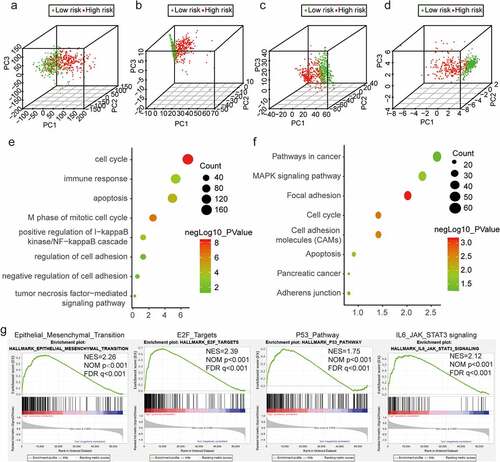
Table 2. The EMT-related lncRNAs, miRNAs, and mRNAs included in the ceRNA network
Figure 6. EMT-related ceRNA network and functional analysis of EMT-related lncRNAs. (a) Global view of the ceRNA network in glioma. Circles, triangles, and diamonds represent lncRNAs, miRNAs, and mRNAs, respectively. (b, c) GO and KEGG pathway enrichment analyses of mRNAs in the network. The horizontal axis shows the number of enriched genes, and the color intensity represents the corrected P value. (d, f) Genes in significant bioprocesses. (e, g) Cluster analysis of genes and pathways with related functions and enrichment of each functional pathway
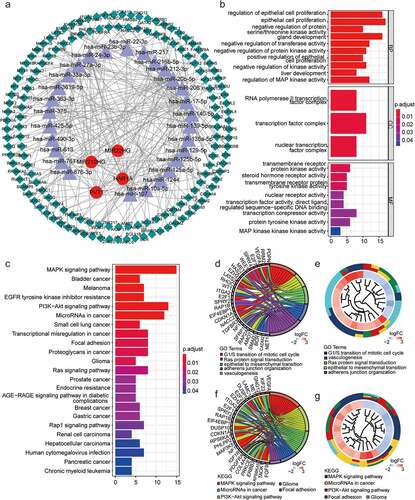
Figure 7. Establishment of TFs‐LncRNAs regulatory networks and associations between the expression of EMT-related lncRNAs and immune infiltration in glioma. (a)The network based on potential regulatory mechanisms between TFs and the nine EMT-related lncRNAs. (b) Heatmap of enriched terms across the 25 TFs, colored according to p-value. Network of enriched terms colored according to (c) cluster ID (nodes with the same cluster ID are typically close to each other) and (d) p-value (terms with more genes tend to have higher p-values). (e) associations between the expression of EMT-related lncRNAs and immune infiltration in glioma
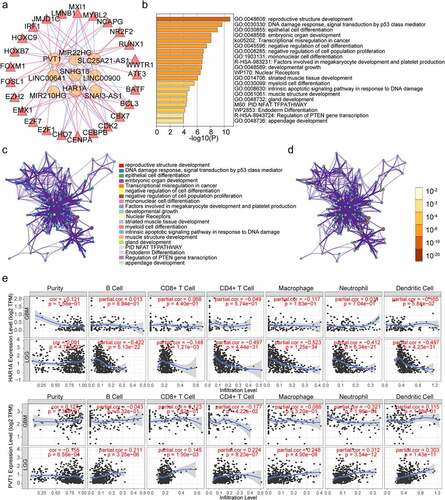
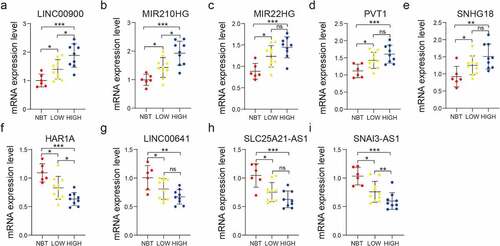
Figure 8. Validation of the bioinformatics results using RT-qPCR assay. Comparison of LINC00900 (a), MIR210HG (b), MIR22HG (c), PVT1 (d), SNHG18 (e), HAR1A (f), LINC00641(g), SLC25A21-AS1 (h), and SNAI3-AS1 (i) mRNA expression levels in NBT, LGG, and GBM tissues. ns P > 0.05, * P < 0.05, ** P < 0.01, and *** P < 0.001