Figures & data
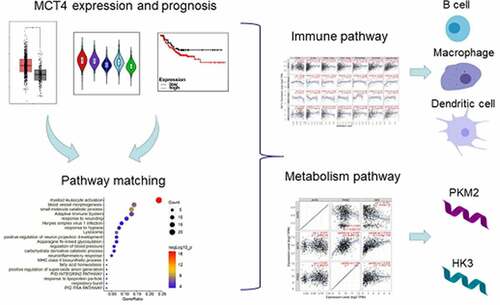
Figure 1. The expression profiles of MCT1 and MCT4 in tumor and normal tissues
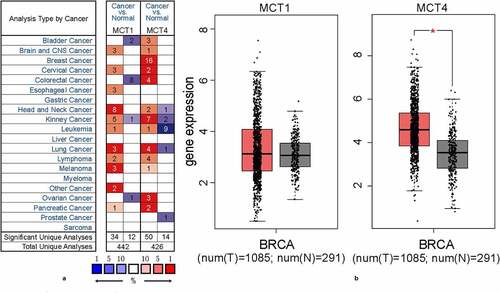
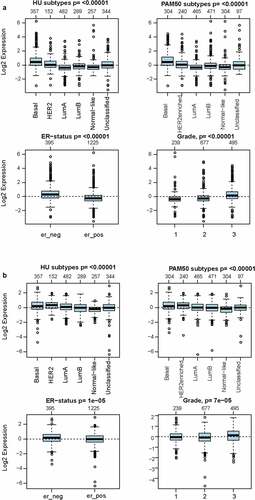
Figure 2. The expression pattern of MCT4 in different subtypes of BC using the GOBO dataset (n = 1881)
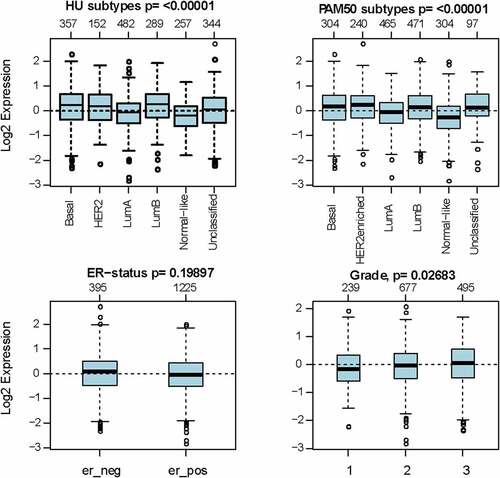
Figure 3. The expression profile of MCT4 in different subtypes of BC using the merged microarray datasets (n = 10,001)
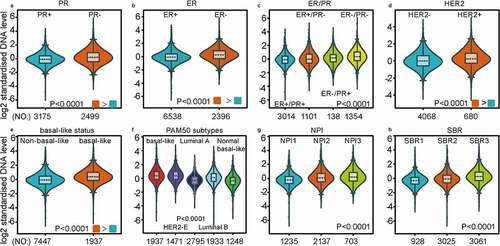
Figure 4. MCT4 expression signature from RNA-seq level exploiting merged RNA-seq datasets (n = 4712)
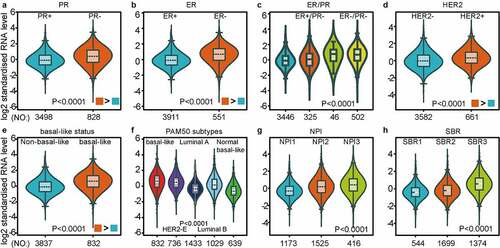
Figure 5. The kaplan-meier survival curves of high and low MCT4 expression in BC through the kaplan-meier plotter database. the RFS in (a) PR+ BC, (b) PR- BC, (c) ER+ BC, (d) ER- BC, (e) HER2+ BC, (f) HER2- BC, (g) basal-like subtype, (h) luminal A subtype, (i) luminal B subtype. RFS: relapse-free survival; HR: hazard ratio
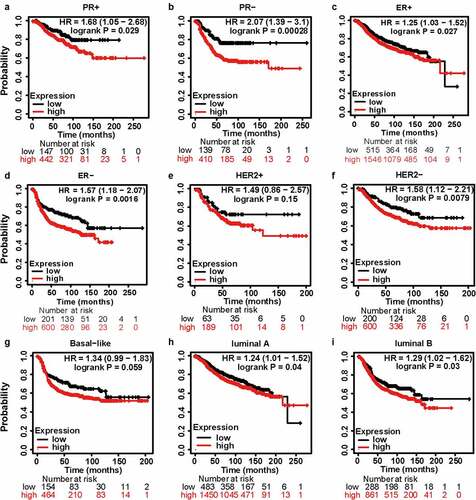
Figure 6. The kaplan-meier survival curves of high and low MCT4 expression in BC through the bc-GenExMiner v4.5
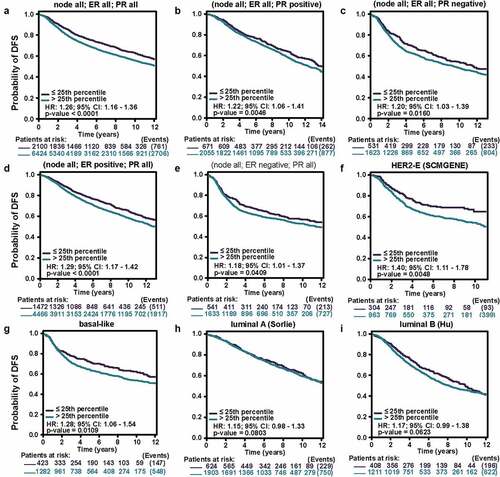
Figure 7. The biological functions of MCT4 showed in enrichment results
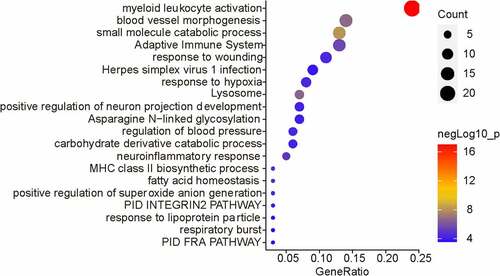
Figure 8. The relationship of MCT4 and immune infiltration in BC
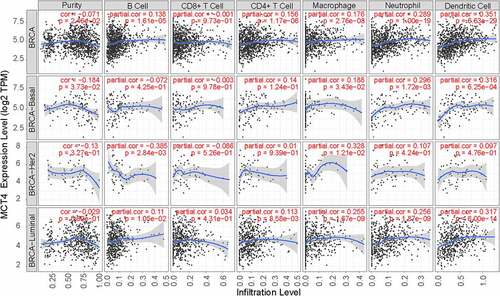
Figure 9. The intersection of MCT4 related genes and central carbon metabolism related genes
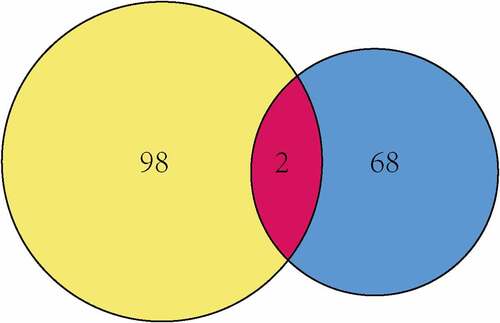
Figure 10. The relationship of MCT4, PKM2, and HK3
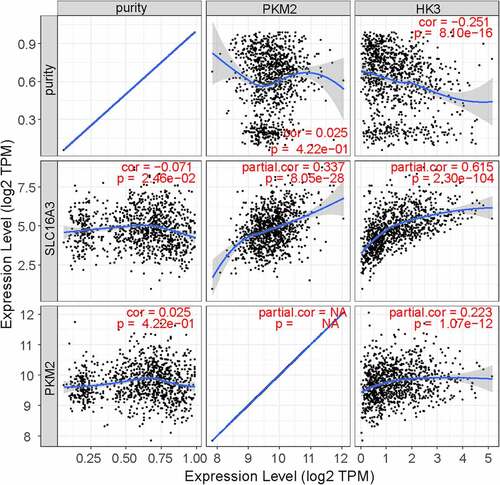
Figure 11. The expression signatures of (a) HK3 and (b) PKM2 in GOBO (n = 1,881)