Figures & data
Figure 1. Intestinal microbial diversity and composition among three groups. (a) Variation in diversity within the three groups by Chao index. PCoA plots based on weighted UniFrac metrics (b) and unweighted UniFrac metrics (c). Average relative abundances of dominant bacterial phylum level (d), class level (e), and genus level (f) in the intestine under different treatments
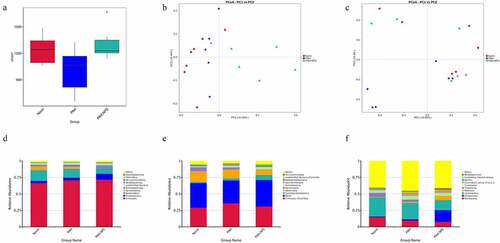
Figure 2. Genes were involved in the pathogenicity of the gut bacteria among three groups. (a) Genes involved in the regulation. (b) All comparisons genes listed in the heatmap
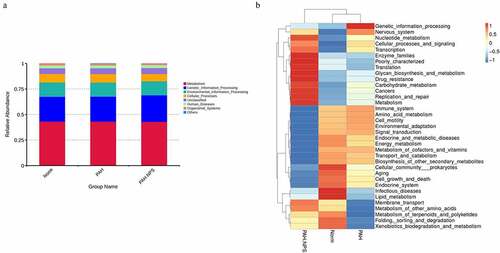
Figure 3. Effect of disruption on the fecal metabolome. Derived PLS-DA score plots and corresponding permutation testing of PLS-DA from the LC-MS metabolite profiles among three groups. Typical LC/MS total ion current (TIC) chromatograms of non target metabolomics from three groups in positive (a) and negative (b) modes. (c) PLS-DA score plot of positive ions. (d) Permutation testing of positive ions. (e) PLS-DA score plot of negative ions. (f) Permutation testing of negative ions. (g) Fecal metabolites disorder among three groups. The data are presented as the mean ± SD, significant differences between groups are indicated as ***P < 0.001, **P < 0.01 and *P < 0.05
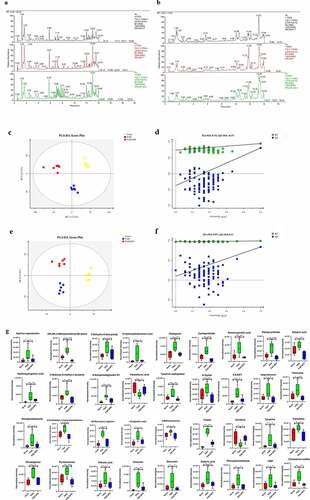
Table 1. Results from Pathway Analysis
Figure 4. The most enriched KEGG pathways analysis. (a) Ingenuity pathway analysis. The size and color are based on the p-value and impact value, small p-value and big pathway impact value indicate that the pathway is greatly influenced. (b) Overall perspective of hedgehog signaling pathway metabolism map. (c) Venn diagram for common pathway among the three groups
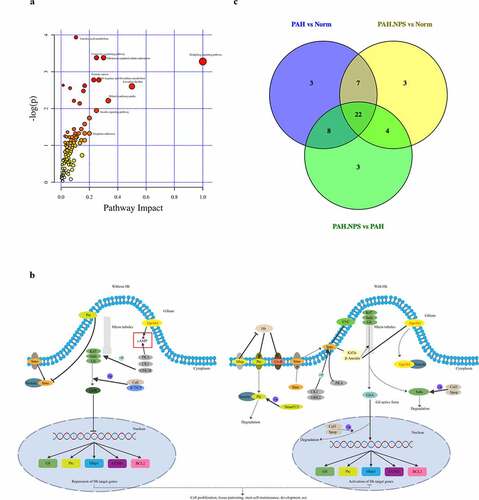
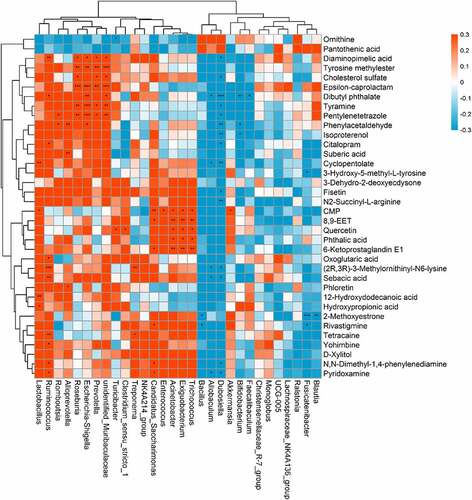
Figure 5. Relationship between gut microbiome and host metabolome. Heat maps indicated positive (red) and negative (blue) correlations between the levels of host metabolites and the identified gut microbiome at the genus levels of NPS2143-treated PAH rats as compared with PAH rats. The legend shows correlation values from −1 to 1 and assigns the appropriate color to them (Red for positive correlations and blue for negative correlations)