Figures & data
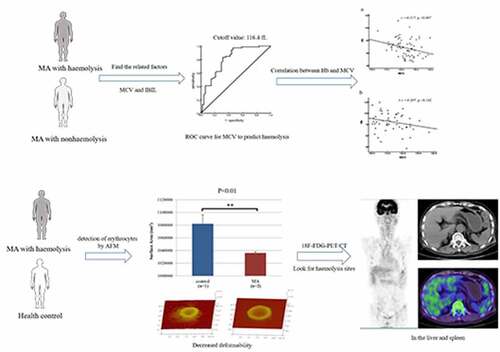
Table 1. Characteristics of patients
Table 2. Related factors of patients with hemolysis in univariate logistic regression analysis
Table 3. Related factors of patients with hemolysis in multivariate logistic regression analysis
Figure 1. ROC curve between MCV and hemolysis
Figure 2. Correlation between Hb and MCV in two groups. a: MA patients with hemolysis; b: MA patients with nonhaemolysis
Figure 3. Erythrocyte morphology. a and b are images of a single erythrocyte in healthy controls and patients, respectively; c and d are altitude profiles of a single erythrocyte in healthy controls and patients, respectively; e and f are 3D models of the single erythrocyte in panels a and b, respectively; g and h are images of the surface membrane of a single erythrocyte in healthy controls and patients, respectively; i and j are the ultrastructures of the membrane of the erythrocyte in panels a and b, respectively
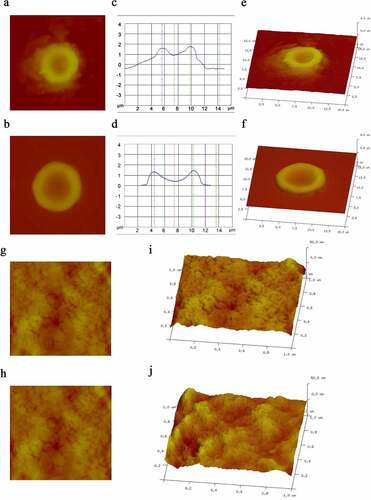
Figure 4. Erythrocyte physical parameters. a: The length of the erythrocytes in the control group was 7.76 ± 0.67 µm, and in the MA patients, it was 8.15 ± 0.69 µm (P = 0.722). The width of the erythrocytes in the control group was 6.24 ± 0.62 µm, and in the MA patients, it was 6.38 ± 0.59 µm (P = 0.878). The length-width ratio of the erythrocytes in the control was 1.26 ± 0.03, and in the MA patients, it was 1.31 ± 0.04 (P = 0.466). b: The Rp-v of the erythrocytes in the control group was 2462 ± 89.99 nm, and that in the MA patients was 1964 ± 134.50 nm (P = 0.021). The Ra of the erythrocytes in the control group was 865.44 ± 38.09 nm, and in the MA patients, it was 658.28 ± 55.23 nm (P = 0.020). c: The surface area of the erythrocytes in the control group was 1082161.56 ± 14204.96 nm2, and in the MA patients, it was 1036047.11 ± 1896.13 nm2 (P < 0.001). L: length of erythrocyte; W: width of erythrocyte; both of which were the maximum cell diameter. Rp-v: peak-valley value, which is the difference between the maximum and minimum height of the Z-axis on the cell surface in the analysis area; Ra: erythrocyte surface roughness, which is the mean roughness in the analysis area, namely the relief on the surface of the erythrocytes; * P value <0.05, ** P value <0.01
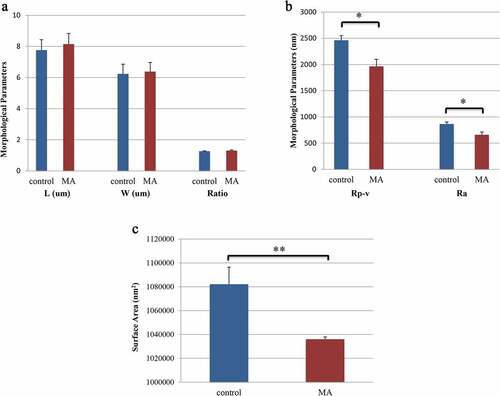
Table 4. Characteristics of healthy control and MA patients with hemolysis
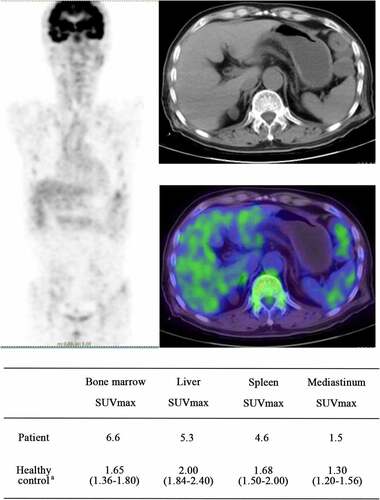
Figure 5. The images of whole body 18F-FDG-PET/CT. a:(median, quartile), SUVmax of healthy people who underwent 18F-FDG-PET/CT examination at our hospital; In the whole-body 18F-FDG-PET/CT images, the higher that the tissue uptake rate of FDG is, the higher that the SUV value is, and the darker that the color in the image is. As the SUV value rises, the image color changes from blue to green, yellow, or even red. Abbreviations: SUVmax, maximum standardized uptake value; 18F-FDG-PET/CT, 18F-fluorodeoxyglucose (18F-FDG) positron emission tomography and computed tomography (PET-CT)