Figures & data
Figure 1. Effects of sulforaphane (SFP) on viability of Caco-2 cells exposed to LPS. (a) Cells were treated with different concentrations of LPS (0.01–4 μg/mL) for 24 h. (b) Cells were treated with different concentrations of sulforaphane (0.1–10 μM) for 24 h. (c) Cells were treated with 1 μg/mL LPS and different concentrations of sulforaphane for 24 h. (d) Cultures treated as in panel (C) were also assayed for LDH activity. Values are mean ± SD (n = 6). Difference between two groups was performed by an independent-samples t-test, *P < 0.05 vs. control group (CN); #P < 0.05 vs. LPS group. The difference between different concentrations of sulforaphane was performed using one-way analysis of variance
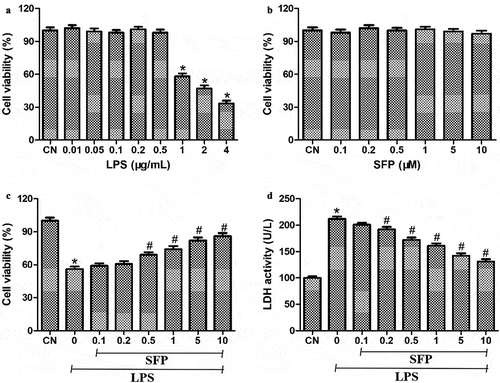
Figure 2. Effects of sulforaphane (SFP) on the monolayer barrier function of Caco-2 cells exposed to LPS. Cells were treated for 24 h with LPS (1 μg/mL) and different concentrations of sulforaphane (0.5–5 μM). (a) TEER measurements. (b) FITC-D4 flux measurements. Values are mean ± SD (n = 6). Difference between two groups was performed by an independent-samples t-test, *P < 0.05 vs. control group (CN); #P < 0.05 vs. LPS group. The difference between different concentrations of sulforaphane was performed using one-way analysis of variance
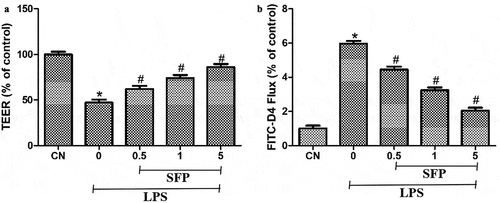
Figure 3. Effects of sulforaphane (SFP) on oxidative stress in Caco-2 cells induced by LPS. Cells were exposed for 24 h to LPS (1 μg/mL) and different concentrations of sulforaphane (0.5–5 μM). (a) Mitochondrial ROS levels, based on MitoSox dye oxidation. (b) Total intracellular ROS levels, based on H2DCF oxidation. (c) MDA levels. (d) H2O2 levels. (e) SOD activity. (f) GPx levels. (g) CAT activity. (h) T-AOC levels. Values are mean ± SD (n = 6). Difference between two groups was performed by an independent-samples t-test, *P < 0.05 vs. control group (CN); #P < 0.05 vs. LPS group. The difference between different concentrations of sulforaphane was performed using one-way analysis of variance
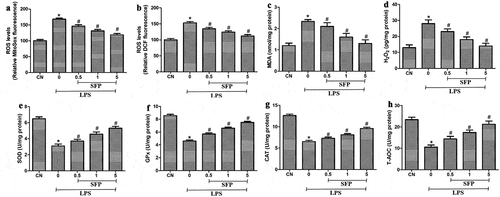
Figure 4. Effects of sulforaphane (SFP) on inflammatory injury in Caco-2 cells induced by LPS. Cells were exposed for 24 h to LPS (1 μg/mL) and different concentrations of sulforaphane (0.5–5 μM). (a) IL-1β. (b) IL-6. (c) IL-8. and (d) TNF-ɑ. Values are mean ± SD (n = 6). Difference between two groups was performed by an independent-samples t-test, *P < 0.05 vs. control group (CN); #P < 0.05 vs. LPS group. The difference between different concentrations of sulforaphane was performed using one-way analysis of variance
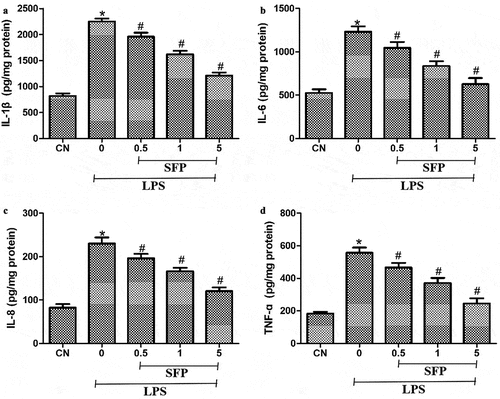
Figure 5. Effects of sulforaphane (SFP) on LPS-induced apoptosis in Caco-2 cells. Cells were exposed for 24 h to LPS (1 μg/mL) and different concentrations of sulforaphane (0.5–5 μM). (a) Levels of caspase-3 mRNA. (b) Levels of caspase-9 mRNA. (c) Activity of caspase-3. (d) Activity of caspase-9. Values are mean ± SD (n = 6). Difference between two groups was performed by an independent-samples t-test, *P < 0.05 vs. control group (CN); #P < 0.05 vs. LPS group. The difference between different concentrations of sulforaphane was performed using one-way analysis of variance
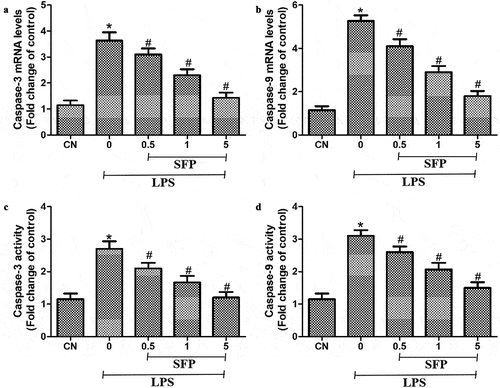
Figure 6. Effects of sulforaphane (SFP) on levels of p-AMPK, SIRT1, and PGC-1ɑ in LPS-treated Caco-2 cells. Cells were exposed for 24 h to LPS (1 μg/mL) and different concentrations of sulforaphane (0.5–5 μM). (a) Representative Western blot. (b-d) Quantitation of Western blots against p-AMPK, SIRT1 and PGC-1ɑ. Values are mean ± SD (n = 3). Difference between two groups was performed by an independent-samples t-test, *P < 0.05 vs. control group (CN); #P < 0.05 vs. LPS group. The difference between different concentrations of sulforaphane was performed using one-way analysis of variance
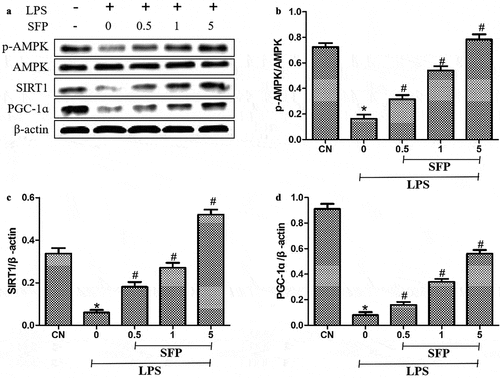
Figure 7. Sulforaphane (SFP) protects Caco-2 cells against LPS-induced injury by activating AMPK. Cells were exposed for 24 h to LPS (1 μg/mL) and SFP (1 μM). (a) Representative Western blot. (b-c) Relative levels of SIRT1 and PGC-1ɑ. (d) Cell viability. (e) Mitochondrial ROS levels, based on MitoSox dye oxidation. (f) IL-1β levels. Values are mean ± SD (n = 3). *P < 0.05 vs. control group (CN); #P < 0.05 vs. LPS group; $P < 0.05 vs. LPS+SFP group
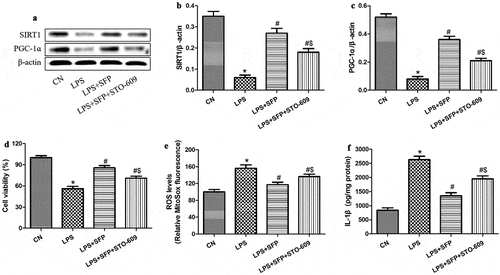
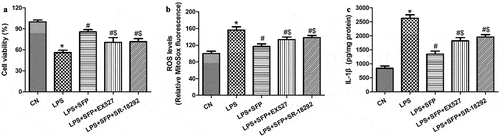
Figure 8. Sulforaphane (SFP) protects Caco-2 cells against LPS-induced injury by activating the AMPK/SIRT1/PGC-1ɑ pathway. Cells were exposed for 24 h to LPS (1 μg/mL) and SFP (1 μM) in the presence or absence of a SIRT1 inhibitor (EX527) or PGC-1ɑ inhibitor (SR-18,292). (a) Cell viability. (b) Mitochondrial ROS levels, based on MitoSox dye oxidation. (c) IL-1β levels. Values are mean ± SD (n = 3). *P < 0.05 vs. control group (CN); #P < 0.05 vs. LPS group; $P < 0.05 vs. LPS+SFP group