
Figures & data
Figure 1. Differentially expressed genes (DEGs) from the three datasets. (a) The volcano plots of genes expression in GSE68204, GSE87211, and GSE90627. (b) Venn chart of DEGs shared between three GEO datasets (GSE68204, GSE87211, and GSE90627). (c) Protein-protein interaction (PPI) network of microRNA and target DEGs. Blue = downregulated DEGs; Red = upregulated DEGs; Green = microRNA
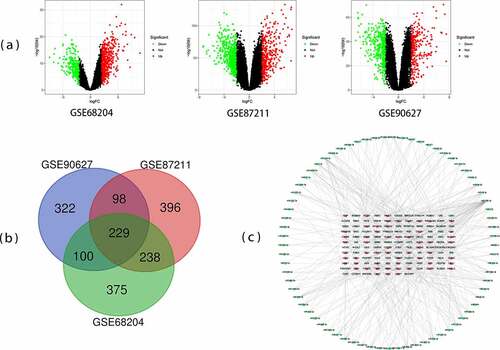
Table 1. Significantly enriched GO terms and KEGG pathways of DEGs
Table 2. GO and KEGG pathway enrichment analyses of DEGs in the most significant module
Figure 2. Protein-protein interaction (PPI) networks and hierarchical clustering analysis of hub genes. (a) Module 1 consisted of 12 nodes and 66 edges. (b) Hub genes’ PPI network was obtained using the MCC algorithm in the cytoHubba tool kits. (c) Utilizing UCSC construct hub genes’ hierarchical clustering. Blue: up-regulated; Red: down-regulated. MCC: Maximal Clique Centrality
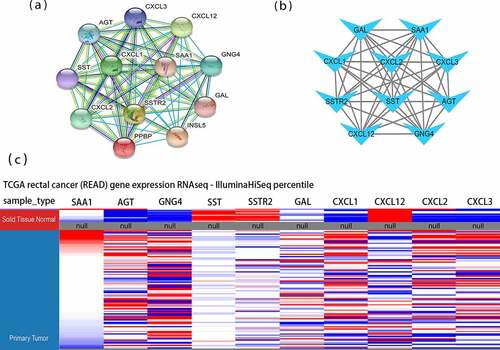
Figure 3. After Oncomine database analysis of the ten hub genes, six hub genes were differentially expressed in READ and para-carcinoma tissue. The expression of CXCL1, CXCL2, CXCL3, GAL, GNG4, and SAA1 were plotted to draw the boxplot; 1: rectum samples (n = 65); 2: READ samples (n = 65). READ: rectal adenocarcinoma
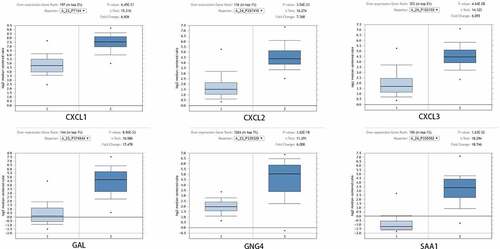
Figure 4. After analysis of the ten hub genes, the RNA expression levels of seven hub genes in tumor tissues and para-carcinoma tissues were significantly different. Data were obtained from TCGA and the GTEx projects (gray: normal; red: tumor). *p-value < 0.01. READ: rectal adenocarcinoma
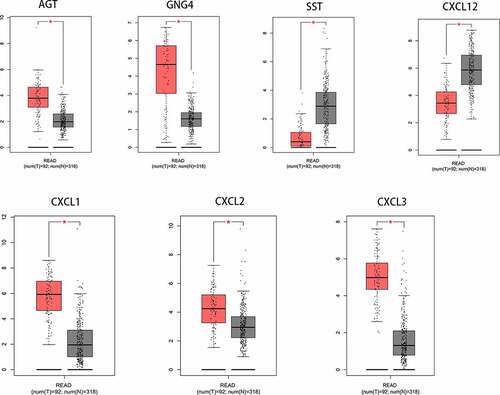
Figure 5. The gene expression levels of CXCL1, CXCL2, and CXCL3 were evaluated in cancer vs. normal tissue in three studies using Oncomine analysis. 1. Rectal Adenocarcinoma vs. Normal Gaedcke Colorectal, Genes Chromosomes Cancer,2010. 2. Rectal Adenocarcinoma vs. Normal Kaiser Colon, Genome Biol, 2007. 3. Rectal Adenocarcinoma vs. Normal TCGA Colorectal, No Associated Paper, 2011
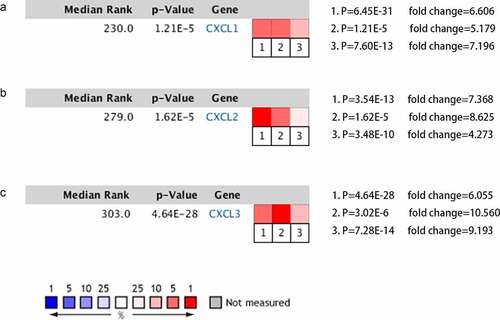
Figure 6. Result of the miRNA enrichment analysis from the MIENTURNE web tool. CXCL1, CXCL2, and CXCL3 were analyzed and hsa-miR-1-3p was significantly associated with these three genes (FDR < 0.01)
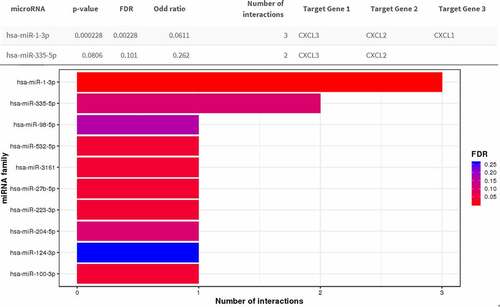
Figure 7. Correlation analyses between the expression of three hub genes and immune markers. The scatter plots of CXCL1, CXCL2, and CXCL3 with tumor purity, B cell, CD8 + T cell, CD4 + T cell, macrophage, neutrophil, and dendritic cell in READ were respectively drawn by the TIMER online database. There was no obvious association between the expression levels of CXCL1, CXCL2, and CXCL3 and infiltration of B cell, CD4 + T cell, CD8 + T cell, or dendritic cell. Likewise, no statistical correlation was seen between levels of CXCL1, CXCL2, and CXCL3 and tumor purity, whereas the expression of CXCL1, CXCL2, and CXCL3 was significantly positively correlated with macrophage and neutrophil. READ: rectal adenocarcinoma
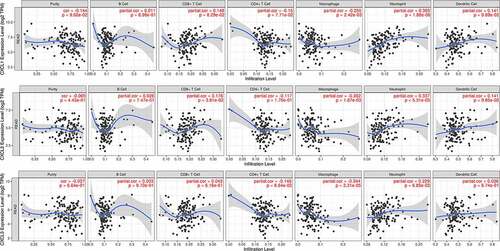
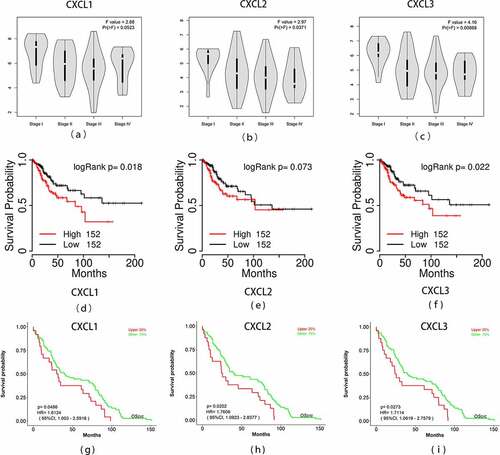
Figure 8. Overall survival analyses and the expression level of three hub genes at different stages. (a)-(c) The expression levels of the three hub genes in READ tissues at different stages was drawn by the GEPIA2 online database. Statistical significance was assessed using analysis of variance. Pr (>F) < 0.05 was accepted as statistically different. (d)-(f) Overall survival analyses of three hub genes were estimated by online tool TCGAPortal. (g)-(i) Overall survival analyses of three hub genes in GSE87211. Statistical significance: p-value < 0.05. READ: rectal adenocarcinoma
Data availability statement
The datasets generated during and/or analyzed during the current study are available from the corresponding author on reasonable request.