Figures & data
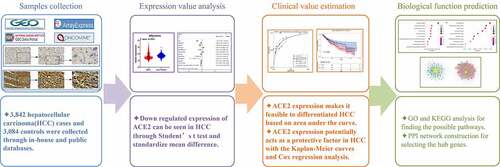
Figure 1. The expression level of ACE2 protein in hepatocellular carcinoma (HCC) and non-tumor liver tissues based on immunohistochemistry. Panels a-c: representative images of ACE2 protein expression in HCC tissues. Panels d-f: representative images of ACE2 protein expression in non-tumor normal liver tissues. In panels a-f, the magnifications of the three images of each panel are 100, 200, and 400 respectively. Panel g: ACE2 protein expression. Panel h: receiver operating characteristic (ROC) curve with area under the curve (AUC) of ACE2 protein expression in HCC tissues
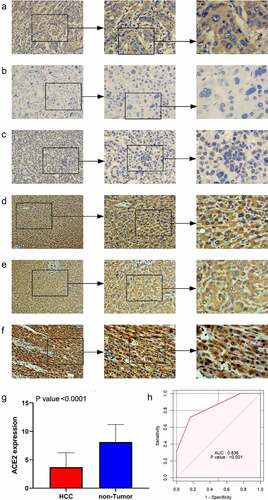
Table 1. Details of IHC result and the 10 high-throughput datasets from public databases with corresponding ACE2 expression level, AUC of the ROC curve, sensitivity and specificity of ACE2 in HCC
Figure 2. The flow chart of the recruitment procedure for the high-throughput datasets
Figure 3. Jitter plots and receiver operating characteristic (ROC) curves of all high-throughput datasets from public databases. Panels a–j the jitter plots of the 10 datasets. Panels k–t: receiver operating characteristic (ROC) curves of the 10 mRNA datasets
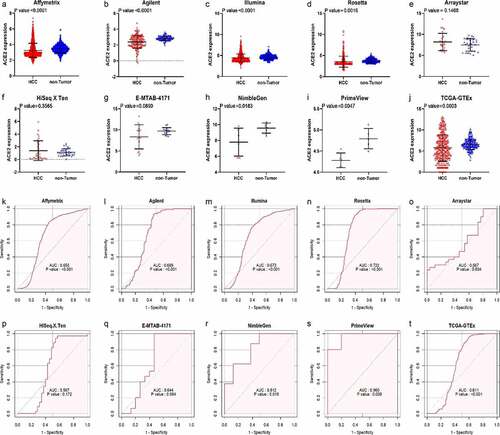
Figure 4. Integrated analysis of the 10 high-throughput datasets and in-house immunohistochemistry (IHC). Panel a: forest plot. Panel b: Egger diagram. Panel c: summary receiver operating characteristic (SROC) curve. Panel d: Deek’s funnel plot, Panel e: chart of the sensitivity and specificity
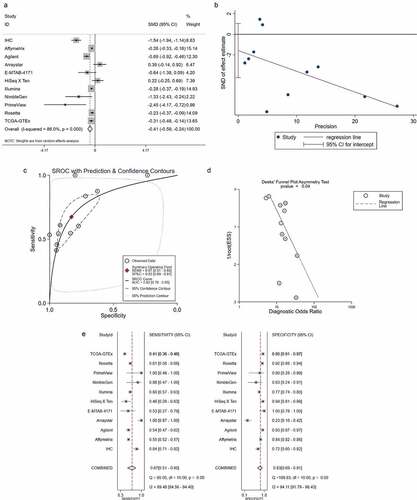
Table 2. Clinical value of ACE2 mRNA expression in HCC based on RNA-sequencing data
Figure 5. Survival curves for high- and low-ACE2 expression based of the dataset from The Cancer Genome Atlas. Panel a: overall survival (OS) curve of hepatocellular carcinoma patients. Panel b: recurrence-free survival (RFS) curve of hepatocellular carcinoma patients
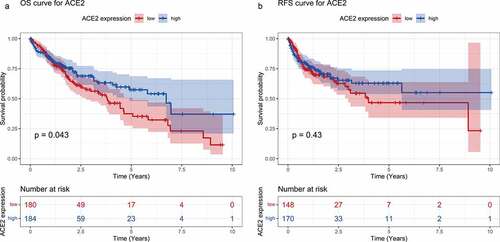
Table 3. Univariate Cox regression and multivariate Cox regression analyses based on the RNA- sequencing data
Figure 6. Venn plot showing the result of the two intersections and the result of the Gene Ontology (GO) and Kyoto Encyclopedia of Genes and Genomes (KEGG) analysis visualized by dot plots. The color of the dot represents the p value of each enriched item, and the size of the dot reflects the genes enriched to the corresponding items. Panel a: selection of ACE2-related downregulated genes. Panel b: selection of ACE2-related upregulated genes. Biological processes (panels c–d), cellular compartments (panels e–f) and molecular functions (panel g) of GO analysis based on ACE2-related downregulated genes. Panel h: molecular function of GO analysis based on ACE2-related upregulated genes. Panel i: KEGG analysis based on ACE2-related downregulated genes. Panel j: KEGG analysis based on ACE2-related upregulated genes
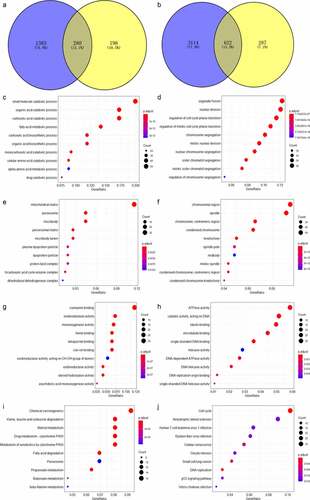
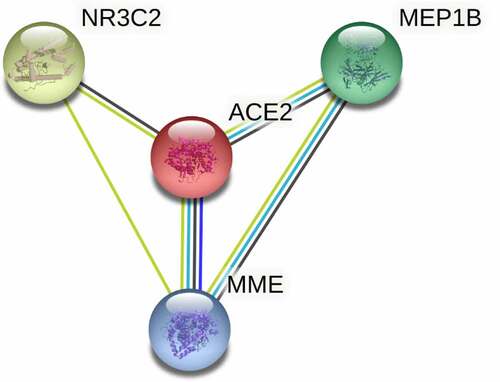
Figure 7. Protein-protein interaction (PPI) network construction of ACE2-related upregulated genes and regulated genes. Panel a: PPI of 280 total down-regulated ACE2-related genes. Panel b: PPI of 622 total up-regulated ACE2 related genes. Larger dot size represents greater degree centrality, and the genes in yellow are the hub genes
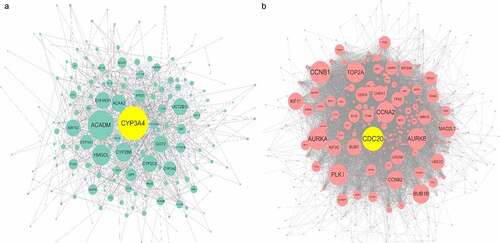
Figure 8. Expression, correlation, and survival analysis of CYP3A4 and CDC20 expression. Panel a: the jitter plot of CYP3A4 expression. Panel b: correlation analysis of CYP3A4 and ACE2 expression. Panel c: overall survival curve of CYP3A4 expression in hepatocellular carcinoma (HCC). Panel d: the jitter plot of CDC20 expression. Panel e: correlation analysis of CDC20 and ACE2 expression. Panel f: overall survival curve of CDC20 in HCC
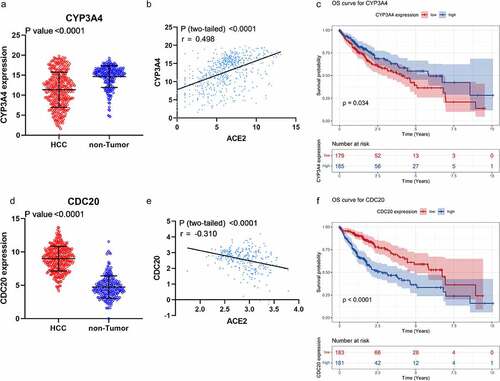
Figure 9. The subnetwork of protein–protein interaction network construction of ACE2-related upregulated genes and downregulated genes