
Figures & data
Figure 1. Decreased expression of GPR39 and A20 in ox-LDL-challenged macrophages. (a-b) Relative protein and mRNA expression of GPR39 and A20 after stimulation with 12.5, 25, 50 and 100 μg/ml of ox-LDL, detected by western blot assay and RT-qPCR. (c-d) Relative protein and mRNA expression of GPR39 and A20 after stimulation with 100 μg/ml of ox-LDL, detected by western blot and RT-qPCR assays. **P < 0.01, ***P < 0.001 vs. Control
Figure 2. GPR39 agonist enhanced A20 expression in ox-LDL-induced macrophages. (a) The viability of macrophages treated with 5 and 10 μM of TC-G 1008, detected by CCK-8 assay. (b-c) Relative protein and mRNA expression of GPR39 and A20 in ox-LDL-challenged macrophages following treatment with 10 μM of TC-G 1008, detected by western blot analysis and RT-qPCR. ***P < 0.001 vs. Control; #P < 0.05, ##P < 0.01, ###P < 0.001 vs. ox-LDL
Figure 3. GPR39 alleviated ox-LDL-induced pro-inflammatory cytokine release in Raw 264.7 cells via inducing A20 expression. (a-b) Relative protein and mRNA expression of A20 after transfection of siRNA-A20-1 or siRNA-A20-2, detected by western blotting and RT-qPCR. ***P < 0.001 vs. siRNA-NC. (c-d) Relative levels of IL-10, IL-1β, IL-6 and TNF-α in ox-LDL-challenged macrophages in different treatment groups were detected by RT-qPCR and ELISA kits. (e) Relative protein expression of COX2 and p65 in ox-LDL-challenged macrophages in different treatment groups, detected by western blot assay. ***P < 0.001 vs. Control; ##P < 0.01, ###P < 0.001 vs. ox-LDL; ΔP<0.05, ΔΔΔP<0.001 vs. ox-LDL+TC-G 1008 μM+siRNA-NC
Figure 4. GPR39 improved ox-LDL-induced lipid accumulation of Raw 264.7 cells in an A20-dependent manner. (a-b) Lipid accumulation in ox-LDL-stimulated macrophages in different treatment group, tested with Oil red O staining. (c-d) TC and FC content in ox-LDL-challenged macrophages in different treatment group, determined by commercial kits. ***P < 0.001 vs. Control; ###P < 0.001 vs. ox-LDL; ΔΔΔP<0.001 vs. ox-LDL+TC-G 1008 μM+siRNA-NC
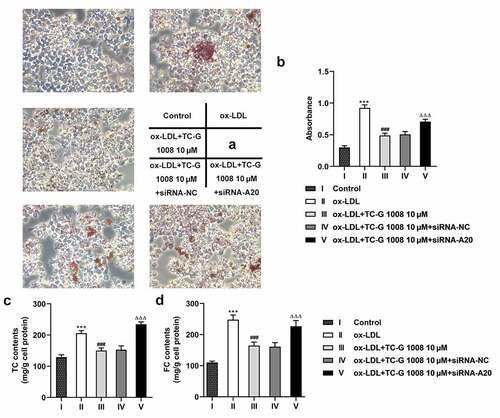
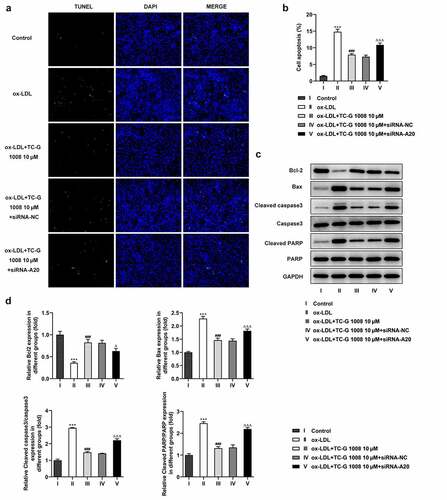
Figure 5. GPR39 reduced ox-LDL-induced macrophage apoptosis via inducing A20 expression. (a-b) The apoptosis of ox-LDL-treated macrophages in different treatment group, measured using TUNEL assay. (c-d) Relative protein expression of apoptosis-related Bcl-2, Bax, cleaved caspase3 and cleaved PARP in macrophages exposed to ox-LDL in different treatment group, detected by western blot assay. ***P < 0.001 vs. Control; ###P < 0.001 vs. ox-LDL; ΔP<0.05, ΔΔΔP<0.001 vs. ox-LDL+TC-G 1008 μM+siRNA-NC
Availability of data and materials
The datasets used and/or analyzed during the present study are available from the corresponding author on reasonable request.