Figures & data
Figure 1. Overall survival of GC patients in the FAT2-mutant and FAT2-wildtype groups
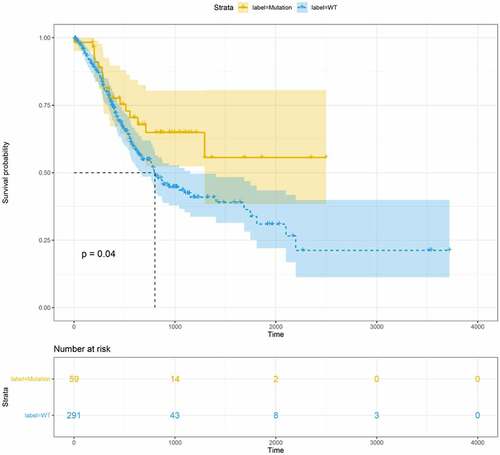
Figure 2. Identification of the DElncRNAs and DEmRNAs between the FAT2-mutant and FAT2-wildtype groups. (a) Volcano plot for DElncRNAs. (b) Volcano plot for DEmRNAs. (c) Heatmaps for the DElncRNAs. (d) Heatmaps for the DEmRNAs
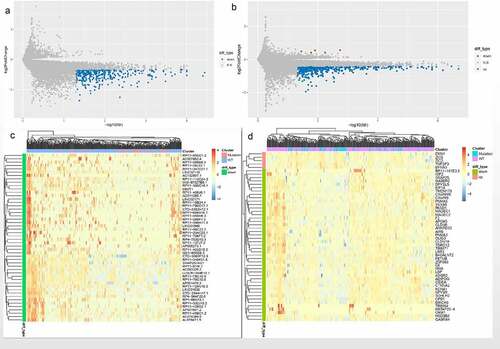
Figure 3. Functional enrichment analysis related to DEmRNAs. (a) Significantly enriched biological processes in the GO analysis. (b) Significantly enriched cell components in the GO analysis. (c) Significantly enriched molecular function in the GO analysis. (d) Significantly enriched pathways in KEGG analysis
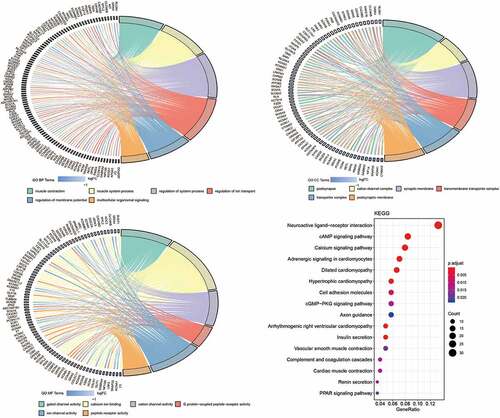
Figure 4. Cox proportional hazards regression analysis of lncRNAs. (a) Forest plot of risk factors. (b) The AUC for risk score was calculated according to the ROC curve. (c) Nomogram of OS prediction in GC
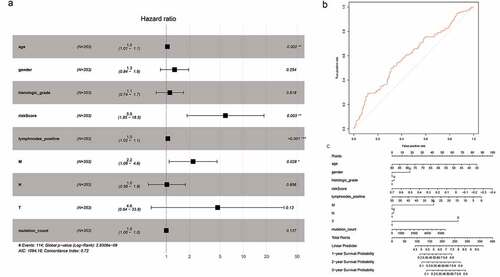
Figure 5. Cox proportional hazard regression analysis of mRNAs. (a) Forest plot of risk factors. (b) The AUC for the risk score was calculated according to the ROC curve. (c) Nomogram of OS prediction in GC
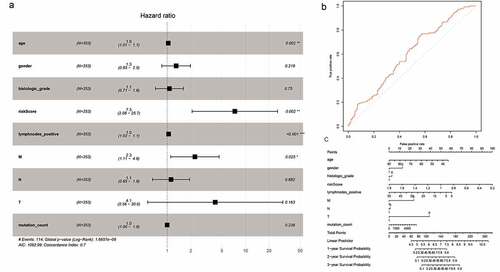
Figure 6. The effect of RP11-21C4.1 on the prognosis of GC. (a) The expression value of RP11-21C4.1 in FAT2-mutant and FAT2-wildtype GC. (b) Kaplan–Meier curves for the OS of GC patients in the high- and low-RP11-21C4.1 groups. (c) The AUC for RP11-21C4.1 was calculated according to the ROC curve. (d) Multivariable Cox regression analysis. (e) Cancer gene enrichment analysis based on the state of RP11-21C4.1 expression
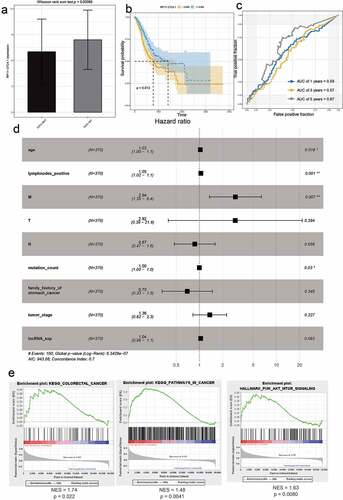
Figure 7. The effect of SVEP1 on the prognosis of GC. (a) The expression value of SVEP1 in FAT2-mutant and FAT2-wildtype GC. (b) Kaplan–Meier curves for the OS of GC patients in the SVEP1 high- and low-expression groups. (c) The AUC for SVEP1 was calculated according to the ROC curve. (d) Multivariable Cox regression analysis. (e) Gene enrichment analysis based on the state of SVEP1 expression
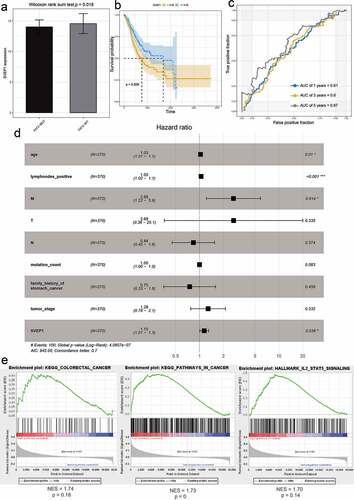
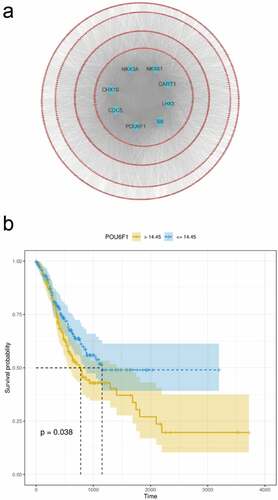
Figure 8. Construction of the TF-mRNA network. (a) TFs enriched for DEGs between the SVEP1 high- and low-expression groups. (b) The association between POU6F1 and the prognosis of GC