Figures & data
Table 1. Clinical information of patients with PE and healthy control
Figure 1. Levels of prospero homeobox 1-antisense RNA 1 (PROX1-AS1) were significantly elevated in the patients with preeclampsia (PE). (a) The expression levels of PROX1-AS1 in the placenta tissues of the patients with PE and the controls were tested using quantitative reverse transcription-polymerase chain reaction (qRT-PCR). (b) The expression levels of PROX1-AS1 in the blood samples of the normal pregnant women and those with PE were detected using qRT-PCR. ***P < 0.001
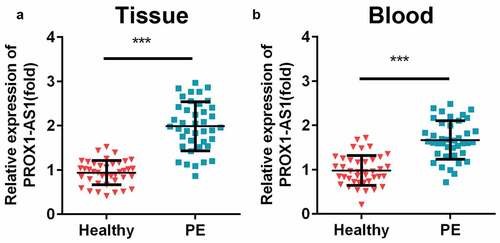
Figure 2. Loss of PROX1-AS1 facilitated the cellular processes of HTR-8/SVneo cells. (a) aRT-PCR was used to measure the transfection efficiency of the transfection of HTR-8/SVneo cells with si-nc, si-PROX1-AS1 1# and si-PROX1-AS1 2#. (b) Cell migration abilities were analyzed by the non-Matrigel transwell assay. (c) Quantification analysis of B. (d) Cell invasion abilities were analyzed by the Matrigel transwell assay. (e) Quantification analysis of D. (f) Flow cytometry was used to measure the apoptosis cells. (g) Quantification analysis of F. ***P < 0.001. **P < 0.01
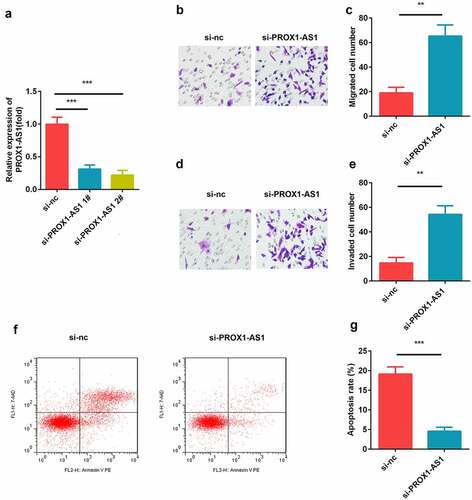
Figure 3. PROX1-AS1 acts as a sponge of microRNA (miR)-211-5p. (a) The complementary binding sites between the 3′-untranslated regions (UTRs) of PROX1-AS1 and miR-211-5p. (b) The luciferase activity was measured using the dual-luciferase reporter analysis and used to verify the targeted relationship. (c) The interaction between miR-211-5p and PROX1-AS1 was tested via RNA pull-down analysis, which confirmed the targeted relationship between them. (d) The expression levels of miR-211-5p were determined using qRT-PCR. (e) The expression levels of miR-211-5p in the placental specimens of the patients with PE as well as the healthy pregnant women were determined. (f) The expression levels of miR-211-5p in the blood samples from the patients with PE as well as the normal pregnant women were determined. ***P < 0.001. **P < 0.01
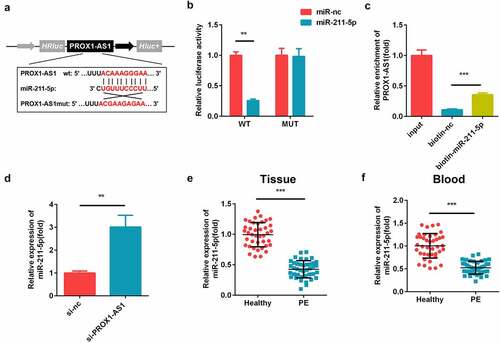
Figure 4. Inhibition of miR-211-5p suppressed the cell migration and invasion induced by the knockdown of PROX1-AS1. (a) qRT-PCR was used to measure the transfection efficiency. (b) Cell migration abilities were analyzed using the non-Matrigel transwell assay. (c) Quantification analysis of B. (d) Cell migration and invasion abilities were analyzed using the Matrigel transwell assay. (e) Quantification analysis of D. (f) Flow cytometry was used to measure the apoptosis cells. (g) Quantification analysis of F. ***P < 0.001. **P < 0.01
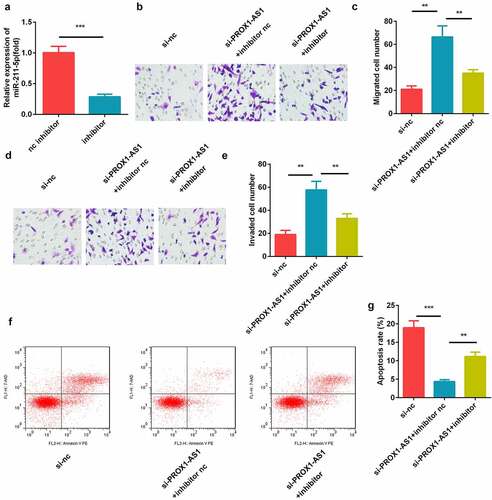
Figure 5. miR-211-5p targeted caspase-9. (a) The complementary binding sites between 3′-UTR of caspase-9 and miR-211-5p. (b) The luciferase assay was used to verify the targeted relationship. (c) The interaction between caspase-9 and miR-211-5p was detected using the RNA pull-down assay. (d) Caspase-9 expression levels were determined using qRT-PCR. (e) Caspase-9 levels were detected in the placental specimens of the patients with PE as well as the healthy pregnant women. (f) Caspase-9 levels were detected in the blood samples of the patients with PE as well as the healthy pregnant women. ***P < 0.001. **P < 0.01
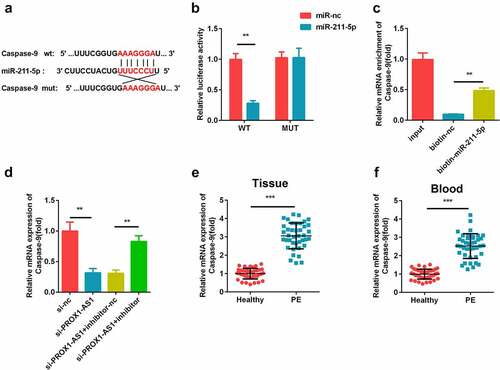
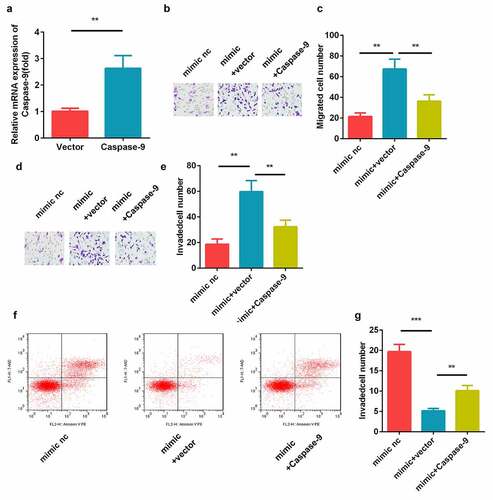
Figure 6. Caspase-9 reversed the cell migration and invasion regulated by miR-211-5p. (a) qRT-PCR was used to measure the transfection efficiency. (b) Cell migration abilities were analyzed using the non-Matrigel transwell assay. (c) Quantification analysis of B. (d) Cell invasion abilities were analyzed using the Matrigel transwell assay. (e) Quantification analysis of D. (f) Flow cytometry was used to measure the apoptosis cells. (g) Quantification analysis of F. **P < 0.01