Figures & data
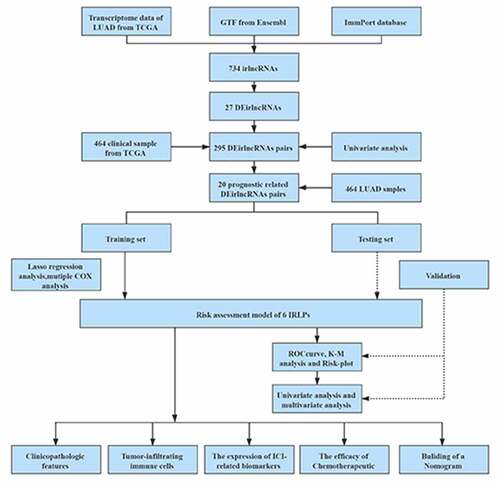
Table 1. Six IRLPs and coefficients in the prognostic risk assessment model
Figure 1. The framework of this study
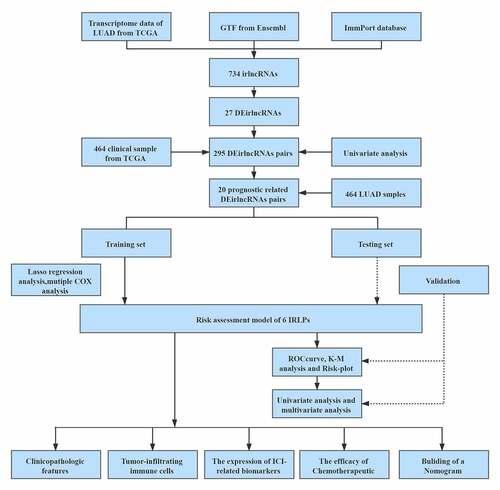
Figure 2. The differentially expressed immune-related lncRNAs (DEirlncRNAs) gained, and LASSO analysis used. (a, b) The 27 DEirlncRNAs were shown in heatmap and volcano plot, respectively. The green, red, and black dots mean downregulated and upregulated genes and no differential expression, respectively. (c, d) Cross-validation for the selection of optimal parameter (lambda) and LASSO coefficient profiles of the candidate DEirlncRNAs pairs, respectively
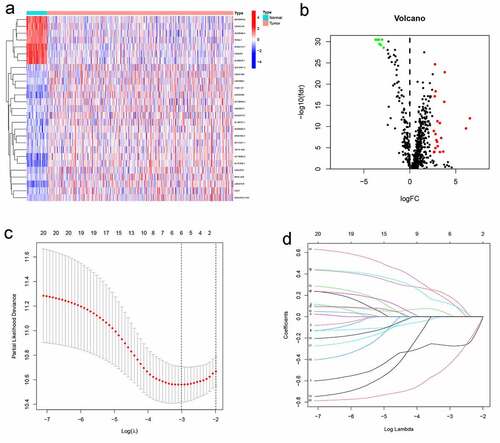
Figure 3. 1-, 3-, and 5-year ROC curves, K-M survival curves, and risk-plots were presented in the training set and testing set. (a, b) ROC curves show that the AUC value of 1- and 3-year were better than 5-year in the training set and testing set. (c, d) K-M survival analysis in the training set and testing set. (e, f) Risk scores and survival outcome of each case are shown in the training set as well as testing set
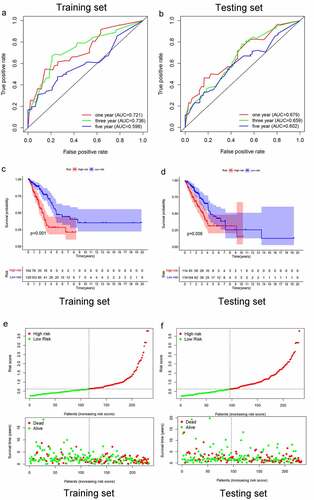
Figure 4. Multivariate independent prognosis analyses of training set and testing set. (a) T stage and risk score were independent predictor in the training set. (b) only risk score was independent predictor in the testing set
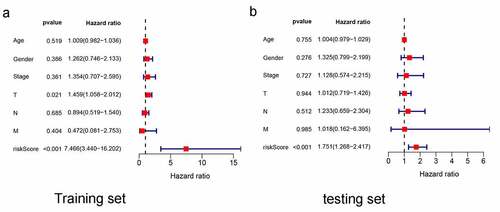
Figure 5. Analysis between clinicopathological features and the risk model. (a–d) A strip chart along with the scatter diagram showed that T stage and N stage, and clinical stage were significantly associated with the risk score. (e) Risk score curve has the maximum AUC value (AUC = 0.679) compared to the other clinicopathological features
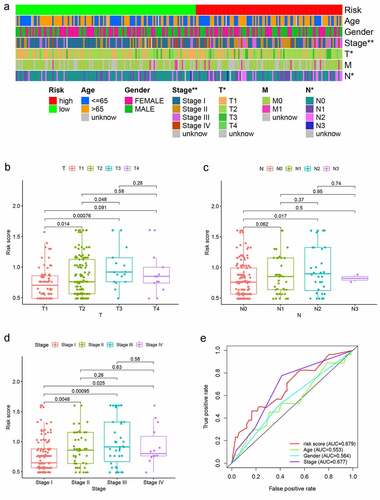
Figure 6. Risk model in tumor-infiltrating immune cells, and ICI-related biomarkers. (a) The high-risk group was more positively correlated with macrophages M0, Neutrophil, T cell CD4+ memory activated as shown in bubble chart. (b–f) The expression of CD47, CD274, and LAG3 were statistically different between high- and low-risk groups, while not in CTLA4, PDCD1 (p < 0.001 = ***, <0.01 = **, and <0.05 = *)
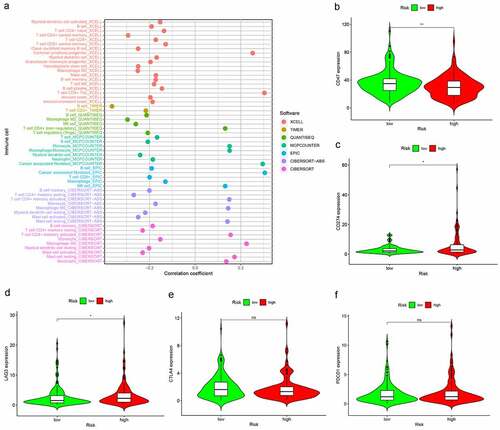
Figure 7. The different sensitivity of high- and low-risk groups to chemotherapeutics drugs. (a–d) The low-risk group was associated with a higher half inhibitory concentration (IC50) in Docetaxel, Gefitinib, Paclitaxel, Rapamycin, Gemcitabine, and Cisplatin
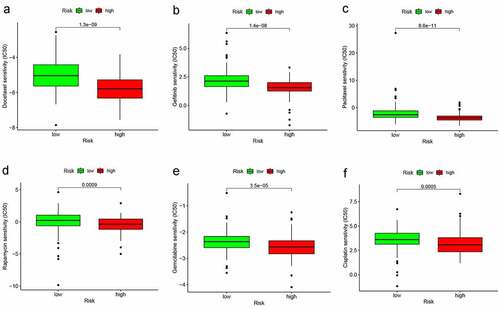
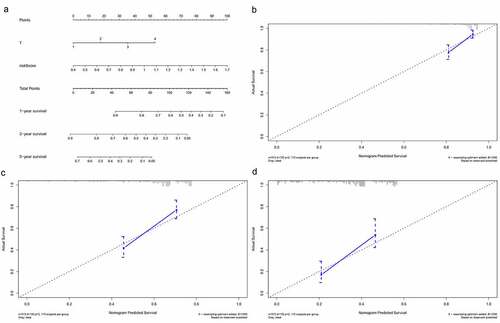
Figure 8. Building and validation of the nomogram predicting overall survival for lung adenocarcinoma patients. (a) The nomogram built based on the T stage and risk signature. (b, c) Calibration curves for predicting 1-, 3-, and 5-year survival of LUAD patients