Figures & data
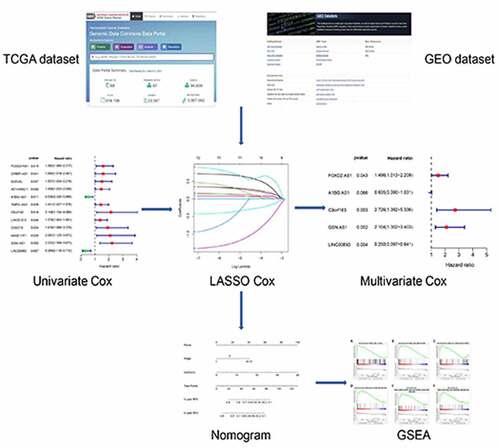
Table 1. Coefficients and multivariable Cox model results in breast cancer
Figure 1. Flow chart illustrating development of the metabolism-related lncRNA signature identified in this study
Figure 2. Development and evaluation of metabolism-related lncRNA signature related to RFS in TCGA cohort. (a) Forest plot of 12 candidate metabolism-related lncRNAs selected by univariate Cox regression analysis. (b) LASSO coefficient profiles of the 10 candidates. (c) Tenfold cross-validation for tuning parameter selection in the LASSO model. (d) Forest plot of 5 candidate metabolism-related lncRNAs selected by multivariate Cox regression analysis. (e) Patient survival status distribution by RS. (f) Patient survival status distribution of the low-risk group and the high-risk group. (g) PCA plot. (h) Kaplan-Meier method was used to plot the RFS curve for the high RS and low RS groups. (i) ROC curve of 5 lncRNA signatures
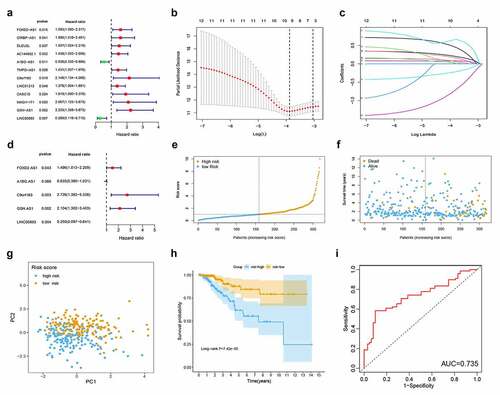
Figure 3. Validation of metabolism-related lncRNA signature related to RFS in GEO cohort. (a) Patient survival status distribution by RS. (b) Patient survival status distribution of the low RS and the high RS. (c) PCA plot. (d) Kaplan-Meier method was used to plot the RFS curve for the high RS and low RS groups. (e) ROC curve of 5 lncRNAs signatures
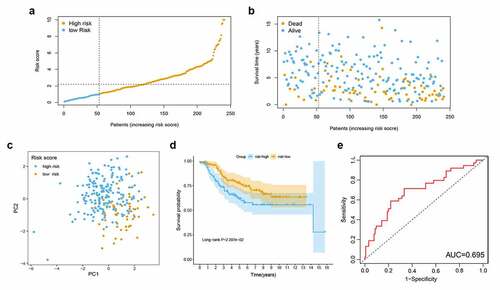
Figure 4. Identification of RFs and development of prognostic nomogram. (a) Univariate Cox regression analysis. (b) Multivariate Cox regression analysis. (c) Prognostic nomogram incorporating RFs for predicting the probability of 3 – and 5-year RFS in BC patients. (d) Time-dependent ROC for 3 – and 5-year RFS predictions of the nomogram. (e, f) Calibration curves for predicting 3 – and 5-year RFS. The nomogram-predicted probability of survival is plotted on the x-axis; actual survival is plotted on the y-axis
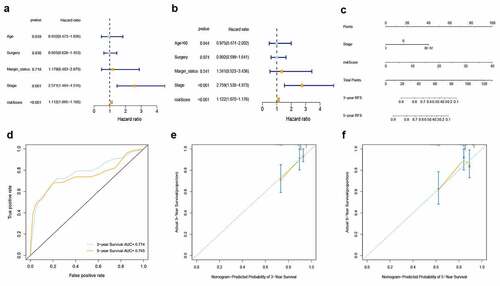
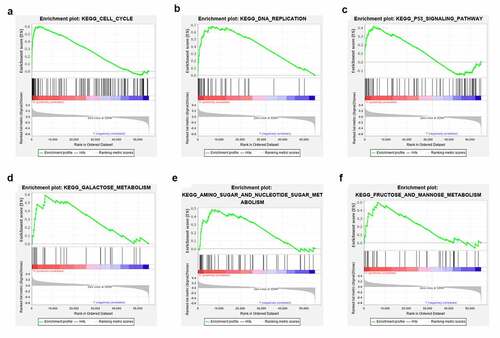
Figure 5. GSEA analysis of differentially expressed genes in high – and low-risk groups. GSEA implied remarkable enrichment of metabolism-related phenotypes in the high-risk group