
Figures & data
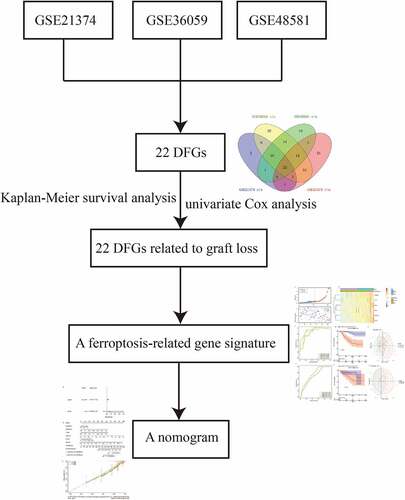
Table 1. The results of Kaplan-Meier survival analysis for 22 DFGs
Figure 1. Identification of the DFGs related to rejection and graft loss. (a-c) The DFGs between rejection and non-rejection group in GSE21374 (a) GSE36059 (b) and GSE48581 (c), respectively. (d) The DFGs between the group which graft loss time less than survival medium time and the group which without graft loss and survival more than survival medium time in GSE21374 dataset. (e) The Venn diagram showed the overlapping genes of these DFGs
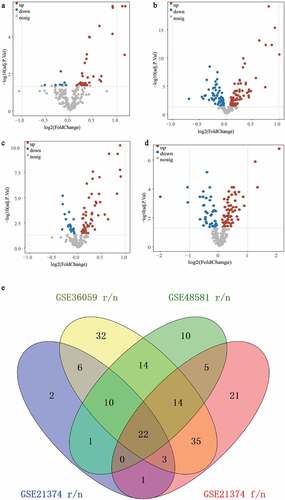
Figure 2. GO annotation and KEGG pathway enrichment analysis and PPI network construction. (a) The enriched top 10 biological processes by 22 DFGs. (b) The top 10 KEGG pathways enriched in by 22 DFGs. (c) The PPI network of the 22 DFGs
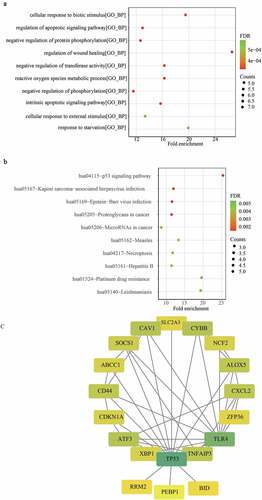
Figure 3. Construction of a ferroptosis related gene signature for predicting the graft loss of renal allograft. (a) K-M survival analysis showed that 22 DFGs were related to the graft loss. (b) univariate Cox regression analysis also showed 22 DFGs were related to the graft loss. (c) Lambda value of the 22 DFGs in LASSO model. (d) The optimal lambda value in Lasso analysis. (e) The optimal DFGs selected by multivariate Cox regression analysis
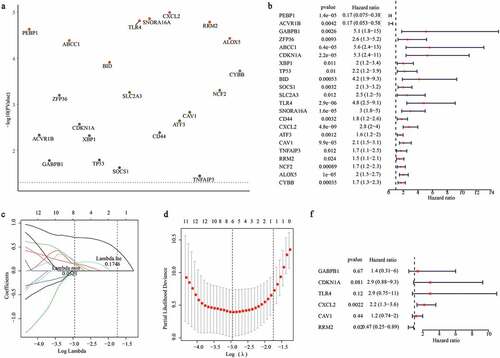
Figure 4. Evaluating the performance of ferroptosis related gene signature in the training set and validation set. (a) The distribution of risk scores and graft status in the training set. (b)The gene expression profiles of six genes in gene signature. (c, f) ROC curves presented the efficiency of the risk signature for predicting the graft loss in the training set (c) and the validation set (f). (d, g) The Kaplan-Meier survival curves showed the prognostic value of the gene signature in the training set (d) and validation set (g). (e, h) PCA analysis of the patients in high- and low-risk group in the training set (e) and validation set (h)
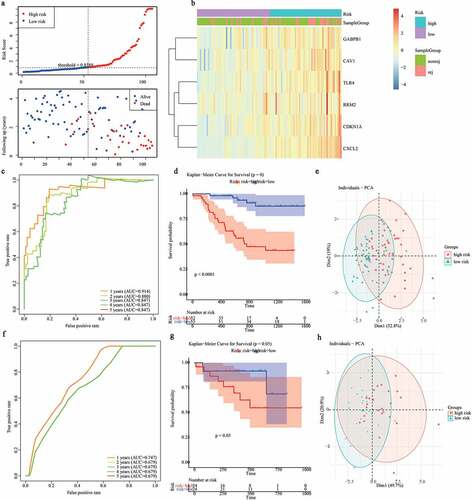
Figure 5. Construction of a nomogram for predicting the 1-, 2- and 3-year graft loss. (a) Univariate Cox regression analysis showed the contribution of each variable to the graft loss. (b) A nomogram for predicting 1-,2-and 3- graft loss. (c) The calibration plot presented the probability for predicting the 1-, 2- and 3- graft loss
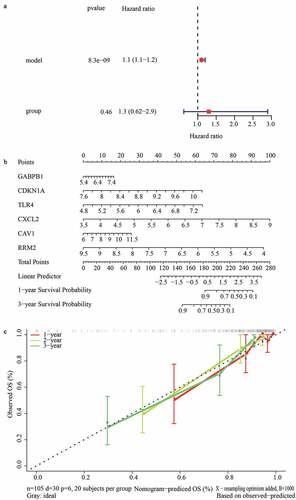
Figure 6. Identification of gene signature related function annotation. (a-d) The GO biological process terms (a), GO cellular components terms (b), GO molecular functions terms (c) and KEGG pathways (d) enriched by differentially expressed genes between high- and low-risk group
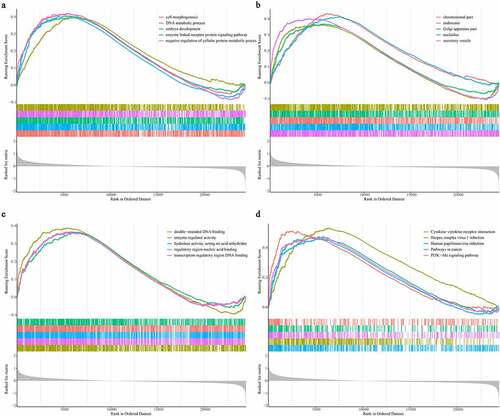
Figure 7. The expression levels of GABPB1, CDKN1A, TLR4, CXCL2, CAV1, and RRM2 between between graft rejection and non-rejection samples from the GEO database. (a) GSE48581. (b) GSE21374. (c) GSE36059
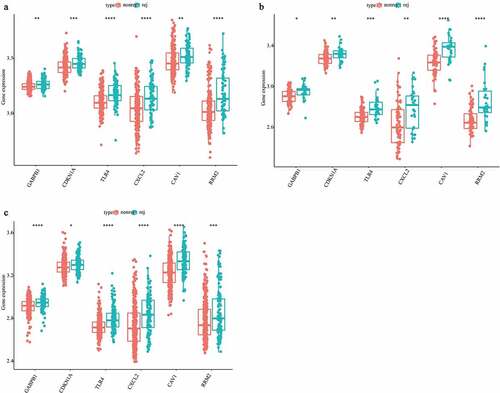
Figure 8. The expression levels of GABPB1, CDKN1A, TLR4, CXCL2, CAV1, and RRM2 between between graft rejection and non-rejection samples from Clinical PBMCs. (a) GABPB1. (b) CDKN1A. (c) TLR4. (d) CXCL2. (e) CAV1. (f) RRM2
Data availability
The datasets (GSE21374, GSE36059, and GSE48581) included in the present study can be found in GEO database (https://www.ncbi.nlm.nih.gov/geo/).