Figures & data
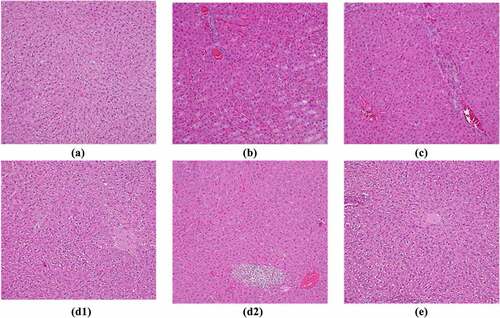
Figure 1. The contents of TG and TC in liver tissues of rats in each group
(Note: * indicated that the contents of TG and TC in liver tissue of the model group were significantly increased (P < 0.01) compared with the normal group; ** meant that the contents of TG and TC in groups A, B, and A + B were lower than those of the model group (P < 0.05); *** showed that the contents of TG and TC in groups A and B were different obviously from those of group A + B (P < 0.01).)
Figure 2. The contents of ALT and AST in liver tissues of rats in each group
(Note: * indicated that the contents of ALT and AST in liver tissue of the model group were increased markedly (P < 0.01) compared with the normal group; ** meant that the contents of TG and TC in groups A, B, and A + B were lower than those of the model group (P < 0.05); *** showed that the content of AST in groups A and B were different obviously from that of group A + B (P < 0.01).)
Figure 3. The contents of HDL-C and LDL-C in liver tissues of rats from the 5 groups
(Note: * indicated that the content of LDL-C of the model group were increased markedly (P < 0.01) compared with the normal group, while the content of HDL-C was decreased sharply; ** meant that the content of LDL-C in groups A, B, and A + B were lower steeply than that of the model group (P < 0.05) but the content of HDL-C was higher greatly than that of the model group (P < 0.05); *** showed that the contents of LDL-C and HDL-C in groups A and B were different obviously from that of group A + B (P < 0.01).)
Figure 4. The content of FFA in liver tissues of rats from the 5 groups
(Note: * indicated that the content of FFA of the model group was risen markedly (P < 0.01) compared with the normal group; ** meant that the content of FFA in groups A, B, and A + B reduced steeply in contrast to that of the model group (P < 0.05); *** showed that the content of FFA in groups A and B were different obviously from that of group A + B (P < 0.01).)
Figure 5. Comparison of FITC-Dextran content of rats from the 5 groups (x ± s, n = 9, and μg/mL)
(Note: * meant that the content of FITC-Dextran in the model group was hugely higher than the content of the normal group (P < 0.01); ** showed that the content of FITC-Dextran in groups A, B, and A + B was lower sharply than that of the model group (P < 0.01).)
Figure 6. HE staining results of pathological tissue of rats from each group
(Note: A: Normal group; B: Model group; C: Group A; D1: Steatosis staining results of group B; D2: Group B; E: Group A + B.)
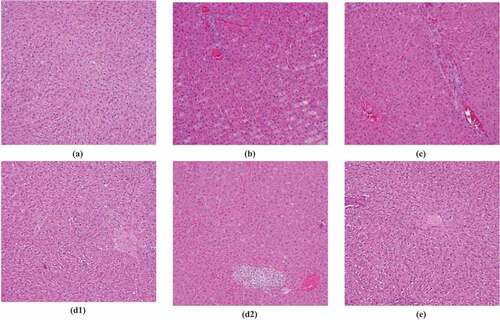
Figure 7. Changes of serum inflammatory cytokines before and after the establishment of the model
(Note: * revealed that the contents of TNF-α, IL-1, and IL-8 in serum of the model group before and after the establishment of the model group were statistically substantial (P < 0.05).)