Figures & data
Figure 1. AK006774 is downregulated in the myocardium and cardiomyocyte subjected to I/R or H/R. (a) The expression of AK006774 in the myocardium after different times of reperfusion was evaluated by qPCR. (b) The expression of AK006774 in cardiomyocytes after different times of oxygenation was detected by qPCR. *p < 0.05 vs 0 h or nc group, **p < 0.01 vs 0 h or nc group
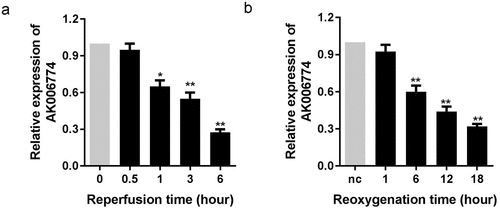
Figure 2. AK006774 inhibits the H/R-induced oxidative stress and apoptosis in vitro. (a) qPCR was used to evaluate the efficiency of AK006774-overexpressing adenovirus. (b-d) The level of LDH, MDA, and ROS were detected using commercial kits. (e) TUNEL staining was carried out to detect the apoptosis of cardiomyocytes. (f) Flow cytometry and Annexin V/PI cardiomyocytes staining were performed to detect the apoptosis of cardiomyocytes. *p < 0.05 vs control group, **p < 0.01 vs Ad-nc or control group, #p < 0.05 vs H/R+ Ad-nc group
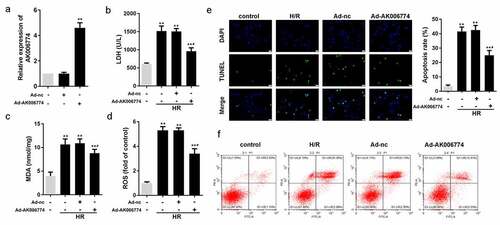
Figure 3. AK006774 inhibits the I/R-induced oxidative stress and cardiac injury in vivo. (a) qPCR was used to evaluate the efficiency of AK006774-overexpressing adenovirus. (b) TTC staining was performed to evaluate the infarct area of the heart. (c) TUNEL staining was carried out to detect the apoptosis of cardiomyocytes. (d–f) The levels of LDH, MDA, and ROS in the myocardium were detected using commercial kits. ** p < 0.01 vs Ad-nc or sham group, # p < 0.05 vs I/R+ Ad-nc
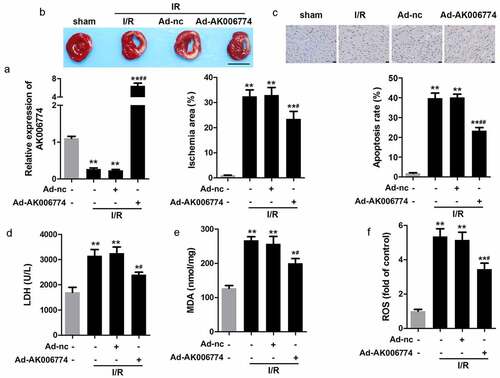
Figure 4. miR-448 is a target of AK006774 in cardiomyocytes. (a) The potential binding sequence between AK006774 and miR-448 was predicted by bioinformatics analysis. (b) A luciferase reporter assay was performed to confirm the interaction between miR-448 and AK006774. (c) qPCR was used to evaluate the level of miR-448 in different groups. (d) RNA pull-down was used to confirm the interaction between AK006774 and miR-448. (e) Pearson correlation analysis was performed to detect the correlation between AK006774 and miR-448. (f) The expression of miR-448 in myocardium after 30 min of ischemia and then different times of reperfusion was evaluated by qPCR. (g) The expression of miR-448 in cardiomyocytes after 4 h of hypoxia and subsequently different times of reoxygenation was detected with qPCR. * p < 0.05 vs miR-nc or biotin-nc, ** p < 0.01 vs miR-nc, ## p < 0.01 vs si-nc group
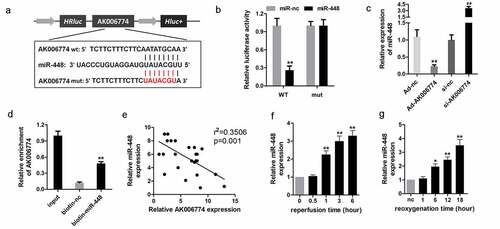
Figure 5. MiR-448 reversed the effect of AK006774 on cardiac I/R injury in vitro. (a) qPCR was performed to assess the level of AK006774 in cardiomyocytes in different groups. (b, c) Flow cytometry and Annexin V/PI staining were performed to detect the apoptosis of cardiomyocytes. (d) TUNEL staining was carried out to detect the apoptosis of cardiomyocytes. (e–g) The level of LDH, MDA, and ROS were detected using commercial kits. *p < 0.05 vs control,**p < 0.01 vs control, # p < 0.05 vs H/R group, ## p < 0.01 vs H/R group, & p < 0.05 vs AK006774+ miR-nc group, &&p < 0.01 vs AK006774+ miR-nc group
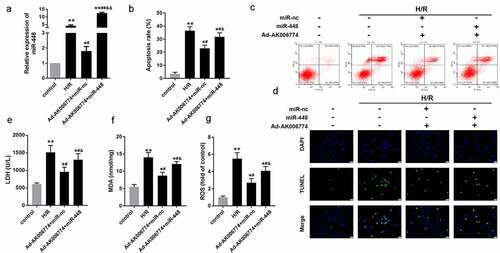
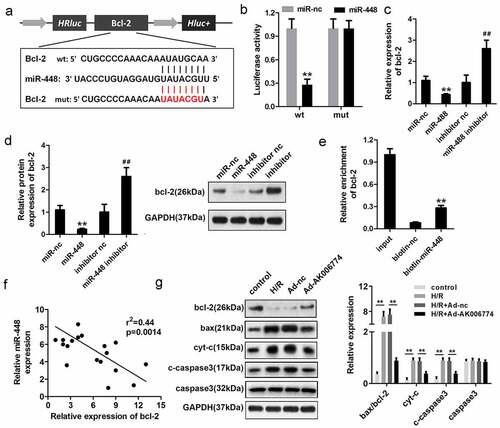
Figure 6. MiR-448 directly targets bcl-2 in cardiomyocytes. (a) The potential targeting region between miR-448 and bcl-2 was predicted by bioinformatics analysis. (b) A luciferase reporter assay was conducted to confirm the binding sequence between miR-448 and bcl-2 in cardiomyocytes. (c) qPCR was used to detect the mRNA level of bcl-2. (d) Western blot was used to detect the expression of bcl-2. (e) RNA pull-down assay was used to detect the interaction between miR-448 and bcl-2. (f) Pearson analysis was performed to investigate the correlation between miR-448 and bcl-2. (g) Western blot was used to evaluate the expression of bcl-2, cyt-c, and cleaved caspase3. **p < 0.01 vs miR-nc or biotin-nc,#p < 0.05 vs inhibitor nc group, ##p < 0.01 vs inhibitor nc group