
Figures & data
Table 1. qPCR primer sequences
Figure 1. Pathological changes in the airway lumen of the four groups and the stenosis is attenuated by PLB in rat TS model. Upon euthanization, the tracheal tissues were prepared and stained with H&E (a-d,f-i). Representative images of NC (a), model (b), TS+NS (c) and TS+PLB (d) groups. (f-i) is the pathological section of the model group. The magnification of (g,i) is 40 × . (g,i) is a small part of (f,h). Angiogenesis (green arrows) is observed in the submucosal layer with numerous inflammatory cells (red arrows) infiltrated beneath the airway epithelium. The number of fibroblasts (blue arrows) is increased, and fibrocytes (yellow arrows) are dispersed in the thickened submucosa with collagen deposition stained in pink (black circle). The degrees of stenosis are presented in (e).Data represent the mean ± SD of the study groups, n = 6 per group. **P < 0.05, **P < 0.01,*** P < 0.001.The degree of stenosis was measured based on the following equation: (1-mucosal surface lumen area/tracheal cartilage lumen area) × 100
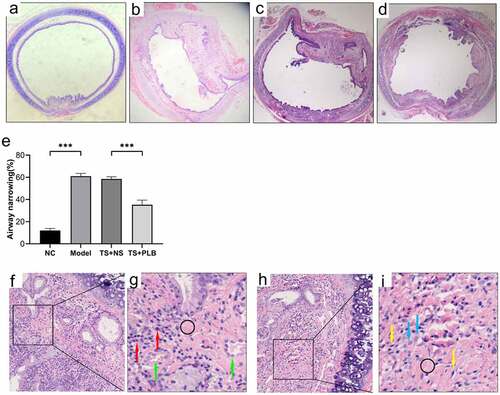
Figure 2. PLB decreases the expression of COL1 and α-SMA as well as suppresses the initiation of Akt/mTOR and TGF-β1/Smad pathways in TS rats. The levels of COL1, α-SMA, p-Akt, Akt, p-mTOR, mTOR, p-Smad2, Smad2, p-Smad3, Smad3 and TGF-β1 proteins were measured by Western blotting and quantified by densitometric analysis (b-e, g-i). Data represent the mean ± SD of the study groups, n = 3 per group. *P < 0.05,**P < 0.01, *** P < 0.001
Figure 3. Cytotoxicity of PLB, and its inhibitory effects on TGF-β1-induced IMR-90 cell proliferation. The viability of IMR-90 cells exposed to PLB (0–20 μM, 1 day) was determined with CCK-8 assay (a). The viability of IMR-90 cells exposed to 10 μM PLB for 1 day 10 ng/mL, in the absence or presence of TGF-β1 induction for 2 days, was evaluated by CCK-8 and EdU incorporation assays (b, c). Scale bar = 100 μm. Data represent the mean ± SD of the study groups, n = 6 or 12 per group. *P < 0.05,** P < 0.01,*** P < 0.001
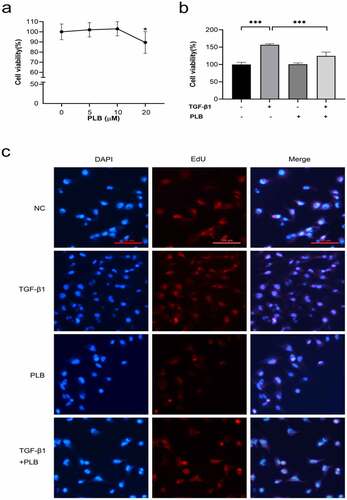
Figure 4. PLB decreases the expression of COL1 and α-SMA as well as suppresses the initiation of Akt/mTOR and TGF-β1/Smad pathways in IMR-90 cells after TGF-β1 induction. the mRNA levels of COL1 (g) and α-SMA (f) were detected by real-time quantitative PCR and normalized with ACTB. The levels of α-SMA, COL1, p-Akt, Akt, p-mTOR, mTOR, p-smad2, smad2, p-smad3 and smad3 proteins were assessed by western blotting and quantified by densitometric analysis (4b-e, 4i-j). (k) Immunocytofluorescence assay of α-SMA. green represents α-SMA-positive cells; and blue stands for DAPI-stained nuclei. scale bar = 100 μm. the concentrations are L-PLB (5 μM),M-PLB (10 μM),H-PLB (20 μM) respectively. The immunocytofluorescence are representative of three independent biological replicates. data represent the mean ± SD of the study groups, n = 3 per group. *P < 0.05,** P < 0.01, ***P < 0.001
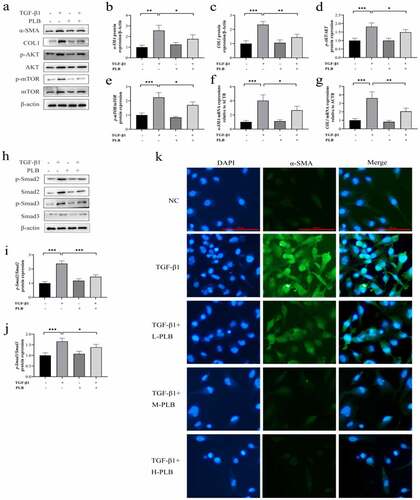
Figure 5. PLB suppresses the activity of TGF-β1-induced IMR-90 cells by regulating Akt/mTOR and TGF-β1/smad pathways. after pretreatment with LY294002, SB-431,542 or rapamycin for 2 h, IMR-90 cells were induced with TGF-β1 for 2 days and subsequently exposed to PLB for 1 day. The levels of p-Akt, Akt, p-mTOR, mTOR, COL1, α-SMA, p-Smad2, Smad2, p-Smad3 and Smad3 proteins in IMR-90 cells exposed to 10 μM LY294002, 10 μM SB-431,542 or 100 nM rapamycin were detected by western blotting (a) and quantified by densitometric analysis (b-g). In the absence or presence of TGF-β1 induction for 2 days, IMR-90 cells were exposed 10 μM PLB for 1 day, followed by 10 μM LY294002, 10 μM SB-431,542 or 100 nM rapamycin for 2 h, respectively, and their viability was measured by CCK8 and EdU incorporation assays (h-i). Scale bar = 100 μm. data represent the mean ± SD of the study groups, n = 6 or 12 per group. *P < 0.05, ** P < 0.01,*** P < 0.001
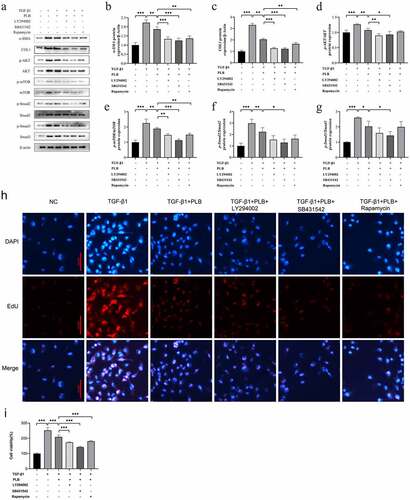
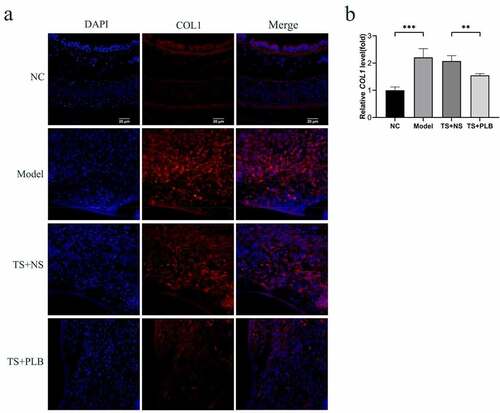
Figure 6. The expression of COL1 in the different groups determined by immunofluorescence (a,b). Scale bar = 20 μm. Red fluorescence ((Cy3, red staining) for the detection of the target protein COL1, blue fluorescence (DAPI staining) for the nucleus.Data represent the mean ± SD of the study groups, n = 6 per group.*P < 0.05,**P < 0.01,***P < 0.001
Availability of data and materials
All data generated or analyzed during this study are included in this published article.