Figures & data
Figure 1. A Venn diagram showed all pathological genes both in obesity and hypertension, and total 154 interaction genes were identified accordingly
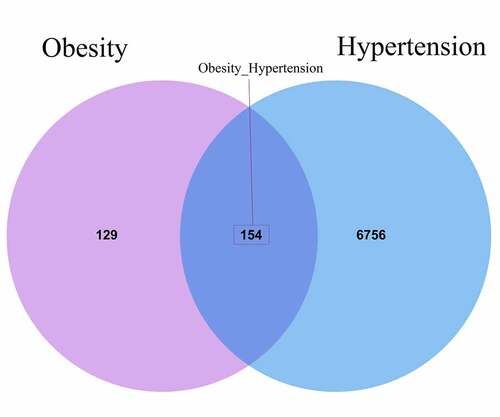
Figure 2. A Volcano map was plotted to feature the differentially expressed genes of obesity and hypertension
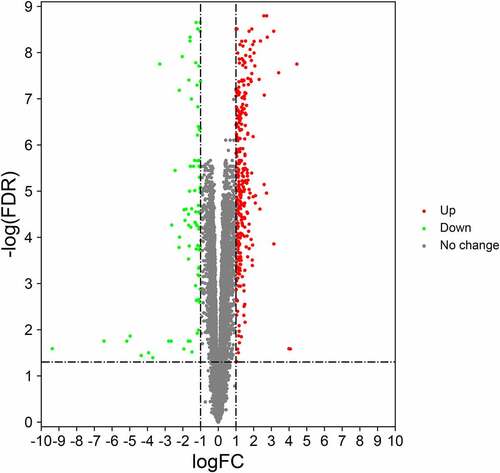
Figure 3. Further Venn diagram analysis highlighted all 21 interaction genes of metformin and obesity-related hypertension before networking visualization
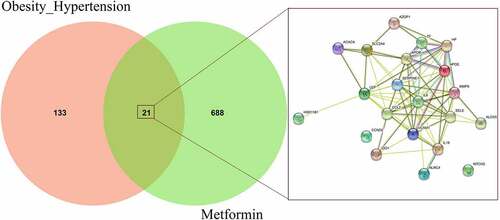
Figure 4. All 21 interaction genes of metformin and obesity-related hypertension were reciprocally connected in network map, and 6 hug genes of metformin against hypertensive obesity were screened out and identified
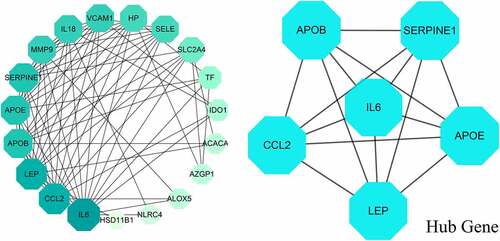
Figure 5. The biological functions from enriched analysis in hug genes were detailed, as highlighted in histogram (a) and circos diagram (b)
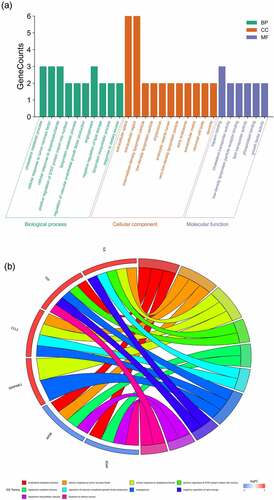
Figure 6. The KEGG-pathways associated molecular mechanisms using enriched analysis in hug genes were uncovered, as visualized in histogram (a) and bubble diagram (b)
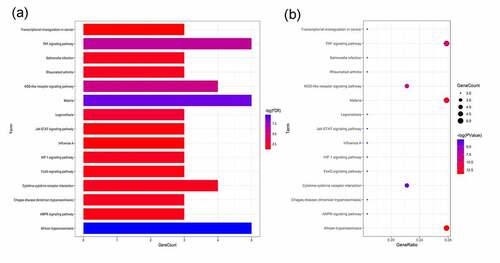
Figure 7. The integrated networking profiles of metformin-target-GO-KEGG-obesity/hypertension were characterized and visualized
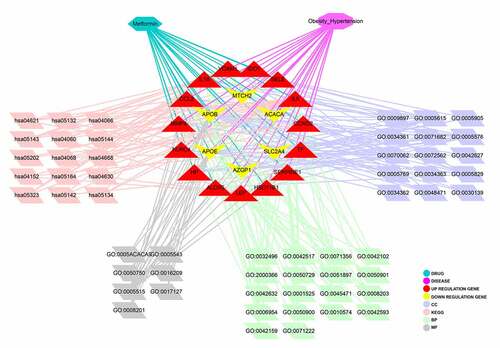
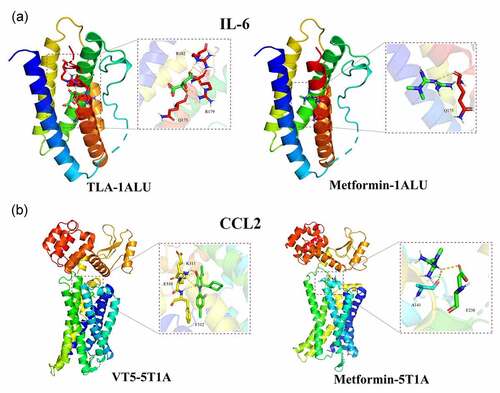
Figure 8. By use of molecular docking analysis, bio-structurally binding capability of metformin with target proteins in obesity/hypertension, including IL-6, CCL2, was identified and demonstrated