Figures & data
Table 1. Timeline of experimental design
Table 2. RT-qPCR primer sequence
Figure 1. N2O-induced nerve cell injury in vivo was relative to regulating TXNIP/NLRP3
A: RT-qPCR and western blot to check TXNIP/NLRP3 mRNA and protein expressions in hippocampus in Control, N2O, and TXNIP-IN-1 groups; B: MWM to detect escape latency in Control, N2O, and TXNIP-IN-1 groups; C: MWM to test platform crossing times in Control, N2O, and TXNIP-IN-1 groups; D: MWM to test the time spent through the target quadrant in mouse; E: MWM to record the swimming speed of the mice; F: Nissl staining to check number of Nissl bodies in hippocampal tissue in Control, N2O, and TXNIP-IN-1 groups; G; TUNEL staining to check hippocampus neuron apoptosis rate in Control, N2O, and TXNIP-IN-1 groups; I: Western blot to detect Bax, cleaved caspase-3 and Bcl-2 expressions in Control, N2O, and TXNIP-IN-1 groups; I: ELISA to detect TNF-α, IL-1β and IL-6 levels in hippocampus in Control, N2O, and TXNIP-IN-1 groups. Values were expressed as mean ± SD (n = 6) display; one-way ANOVA was applied to calculate the significance of each group; the variance was corrected using Tukey’s test. *P < 0.05.
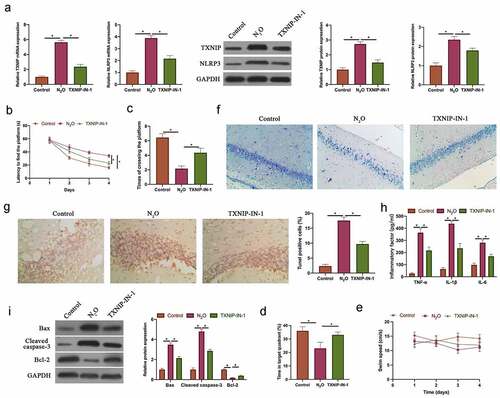
Figure 2. N2O induced neuronal injury in vitro.
A: Representative images of hippocampal neurons; B: Immunofluorescence to detect βIII tubulin and GFAP protein expression in hippocampal neuron cells; C: RT-qPCR to detect TXNIP/NLRP3 mRNA and protein expression in hippocampal neurons in Blank and N2O groups; D: Flow cytometry to detect hippocampal neuron apoptosis in Blank and N2O groups; E: Western blot to detect Bax, cleaved caspase-3 and Bcl-2 protein expressions in hippocampal neurons in Blank and N2O groups; F: ELISA to test TNF-α, IL-1β and IL-6 levels in hippocampal neurons in Blank and N2O groups. Values were expressed as mean ± SD (n = 3) display; one-way ANOVA was applied to calculate the significance of each group; the variance was corrected using Tukey’s test. *P < 0.05.
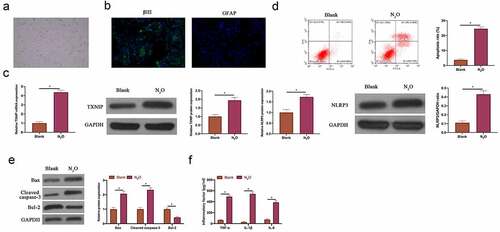
Figure 3. Overexpressing TXNIP or NLRP3 promoted N2O-induced hippocampal neuron injury
A: RT-qPCR and western blot to detect the impact of overexpressing TXNIP and NLRP3 on TXNIP/NLRP3 mRNA and protein expression in hippocampal neurons; B: Flow cytometry to detect the impact of overexpressing TXNIP and NLRP3 on hippocampal neuron apoptosis; C: Western blot to detect the impact of overexpressing TXNIP and NLRP3 on Bax, cleaved caspase-3 and Bcl-2 protein expressions in hippocampal neurons; D: ELISA to detect the impact of overexpressing TXNIP and NLRP3 on TNF-α, IL-1β and IL-6 levels in hippocampal neurons. Values were expressed as mean ± SD (n = 3) display; one-way ANOVA was applied to calculate the significance of each group; the variance was corrected using Tukey’s test. *P < 0.05.
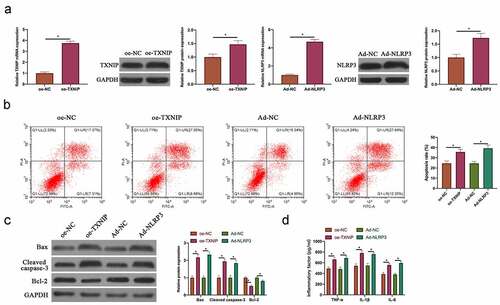
Figure 4. Silencing TXNIP or NLRP3 inhibited N2O-induced hippocampal neuron injury
A: RT-qPCR and western blot to detect the impact of silencing TXNIP and NLRP3 on TXNIP/NLRP3 mRNA and protein expression in hippocampal neurons; B: Flow cytometry to detect the impact of silencing TXNIP and NLRP3 on hippocampal neuron apoptosis; C: Western blot to detect the impact of silencing TXNIP and NLRP3 on Bax, cleaved caspase-3 and Bcl-2 protein expressions in hippocampal neurons; D: ELISA to detect the impact of silencing TXNIP and NLRP3 on TNF-α, IL-1β and IL-6 levels in hippocampal neurons. Values were expressed as mean ± SD (n = 3) display; one-way ANOVA was applied to calculate the significance of each group; the variance was corrected using Tukey’s test. *P < 0.05.
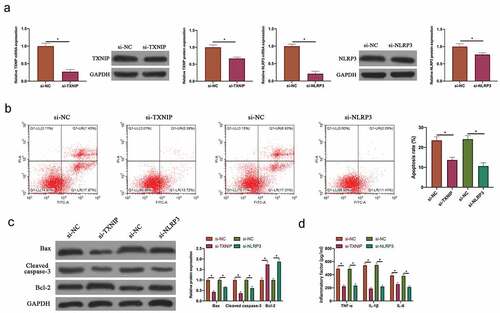
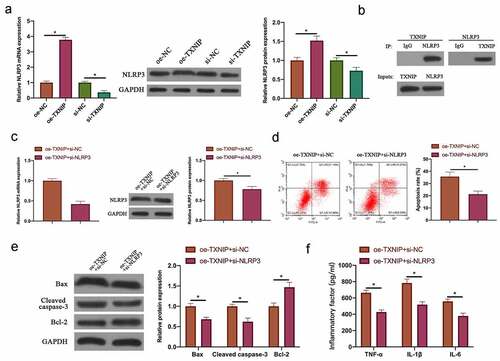
Figure 5. TXNIP/NLRP3 axis participated in N2O-induced hippocampal neuron injury
A: RT-qPCR and western blot to detect NLRP3 mRNA and protein expression in hippocampal neurons after overexpressing or silencing TXNIP; B: Co-IP to detect the interaction between TXNIP and NLRP3; C: RT-qPCR and western blot to detect NLRP3 mRNA and protein expression in hippocampal neurons after co-transfecting oe-TXNIP and si-NLRP3; D: Flow cytometry to detect hippocampal neuron apoptosis rate after co-transfecting oe-TXNIP and si-NLRP3; E: Western blot to detect Bax, Blc-2 and cleaved caspase-3 protein expressions in hippocampal neurons after co-transfecting oe-TXNIP and si-NLRP3; F: ELISA to detect TNF-α, IL-1β and IL- 6 levels in hippocampal neurons after co-transfecting oe-TXNIP and si-NLRP3. Values were expressed as mean ± SD (n = 3) display; one-way ANOVA was applied to calculate the significance of each group; the variance was corrected using Tukey’s test. *P < 0.05.