Figures & data
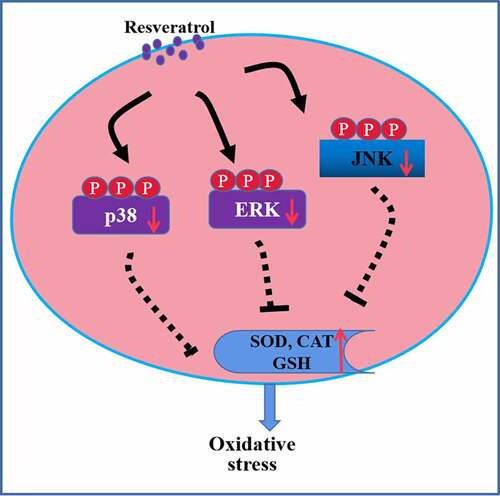
Figure 1. Ability of resveratrol to reduce H2O2-induced killing of RGC-5 cells. (a) structure of resveratrol (res). (b) RGC-5 cells were exposed for 24 h to gradient doses of H2O2 (50–250 μM). (c) RGC-5 cells were treated for 24 h with resveratrol at 0.5–40 μM. (d) RGC-5 cells were pretreated for 4 h with resveratrol at 0.5–40 μM, then 200 μM H2O2 for 24 h. Cell viability was assessed using the CCK8 assay. *P< 0.05 vs control group, #P< 0.05 vs H2O2-treated group
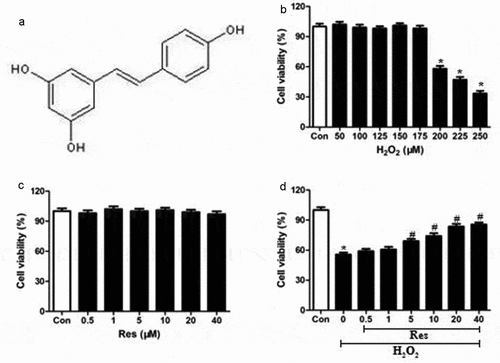
Figure 2. Ability of resveratrol to inhibit H2O2-induced apoptosis of RGC-5 cells. Cells were pretreated for 4 h with resveratrol (Res) at 5, 10, or 20 μM, then exposed to 200 μM H2O2 for 24 h. (a-b) Cell apoptosis was assessed using flow cytometry. (c-e) Levels of cleaved caspase-3 and cleaved caspase-9 were detected using western blots. *P< 0.05 vs control group, #P< 0.05 vs H2O2-treated group
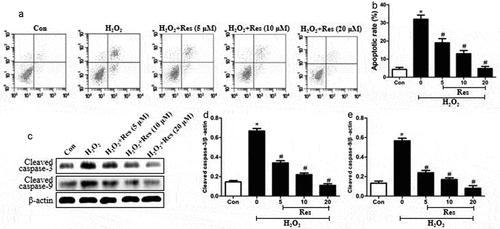
Figure 3. Ability of resveratrol to inhibit H2O2-stimulated generation of ROS and loss of Δψm in RGC-5 cells. Cells were pre-exposed for 4 h to resveratrol (Res) at 5, 10, or 20 μM, then exposed to 200 μM H2O2 for 24 h. (a) Cells were stained with H2DCF-DA at 37°C for 30 min in the dark, then analyzed using flow cytometry. (b) Cells were treated with rhodamine 123 for 30 min at 37°C, then analyzed using flow cytometry. *P< 0.05 vs control group, #P< 0.05 vs H2O2-treated group
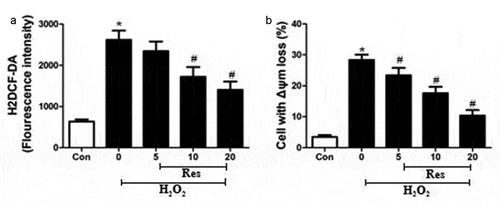
Figure 4. Ability of resveratrol (Res) to enhance the activities of SOD, CAT, and GSH in RGC-5 cells exposed to H2O2. Cells were pre-exposed for 4 h to resveratrol at 5, 10, or 20 μM, then exposed to 200 μM H2O2 for 24 h. The activities of SOD (a), CAT (b), and GSH (c) were assayed. *P< 0.05 vs control group, #P< 0.05 vs H2O2-treated group
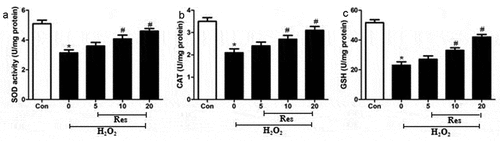
Figure 5. Ability of resveratrol to reduce levels of p-p38, p-ERK, and p-JNK in H2O2-treated RGC-5 cells. Cells were pre-exposed for 4 h to resveratrol (Res) at 5, 10, or 20 μM, then exposed to 200 μM H2O2 for 24 h. Levels of p-p38, p-ERK, and p-JNK were estimated by western blot. *P< 0.05 vs control group, #P< 0.05 vs H2O2-treated group
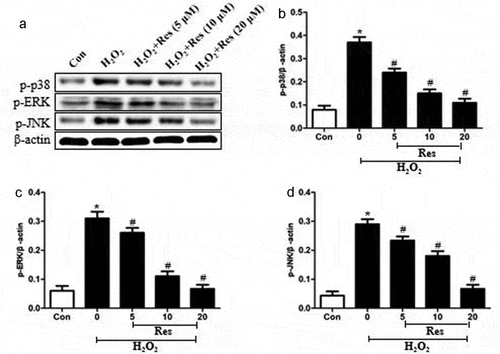
Figure 6. MAPK signaling inhibitors mimic and reinforce the effects of resveratrol on H2O2-induced apoptosis of RGC-5 cells. Cells were pre-exposed for 4 h to resveratrol (Res, 10 μM), PD169316 (1.25 μM), FR180204 (1.25 μM), or SP600125 (1.25 μM), or the combination of resveratrol with each of these inhibitors. Then cells were treated for 24 h with 200 μM H2O2. (a) Cell viability was detected using the CCK8 assay (b) Apoptosis was analyzed using flow cytometry. *P< 0.05 vs control group, #P< 0.05 vs H2O2-treated group, +P< 0.05 vs H2O2+ Res group
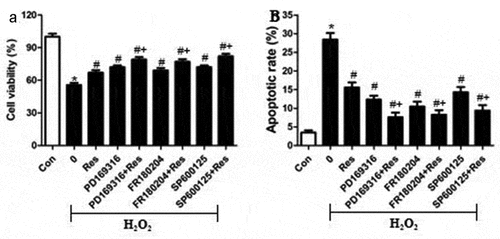
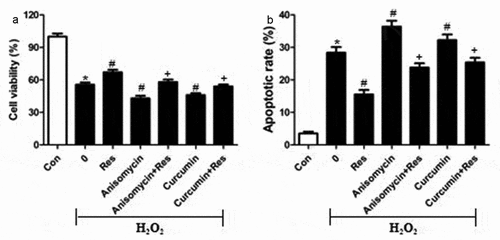
Figure 7. MAPK signaling agonists exacerbate the pro-apoptotic effects of H2O2 on RGC-5 cells. cells were preincubated for 4 h with resveratrol (Res, 10 μM), anisomycin (1.5 μM) or curcumin (1.5 μM), or the combination of resveratrol with each agonist. Then cells were treated for 24 h with 200 μM H2O2. (a) Cell viability was detected using the CCK8 assay (b) apoptosis was analyzed using flow cytometry. *P< 0.05 vs control group, #P< 0.05 vs H2O2-treated group, +P< 0.05 vs H2O2+ Res group