Figures & data
Table 1. Clinical characteristics of the lung cancer patients used in this study
Table 2. Univariate Cox analysis results of TCGA cohort-46 candidate genes
Figure 1. (a)(b) Heat map and volcano map of 257 different gene expression levels. (c) Coefficient distribution of 12 prognostic genes. (d) The dashed lines represent the minimum value and the optimal λ of the optimal volume of the variable respectively. (e) PPI network downloaded from STRING database shows the interaction among 46 candidate genes. Correlation coefficients are expressed in different colors
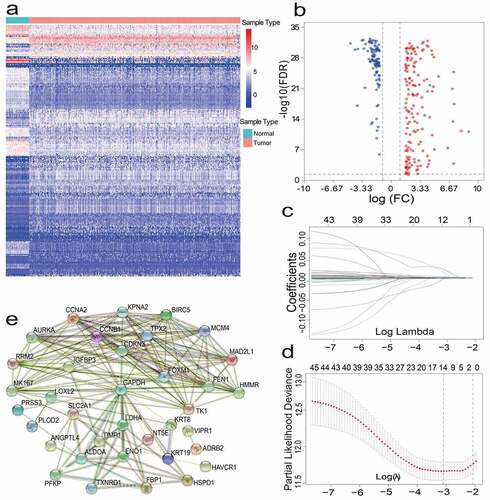
Figure 2. (a) Distribution of median of risk scores and OS status and risk score in TCGA cohort. (b) Survival analysis of TCGA high-risk group and low-risk group (P < 0.001). (c) Nomogram analysis results of TCGA cohort. (d)(e)(f) AUC of time-dependent ROC curves in TCGA cohort for 1 year, 3 years and 5 years. (g)(h)(i) Calibration curve for 1 year, 3 years and 5 years in TCGA cohort
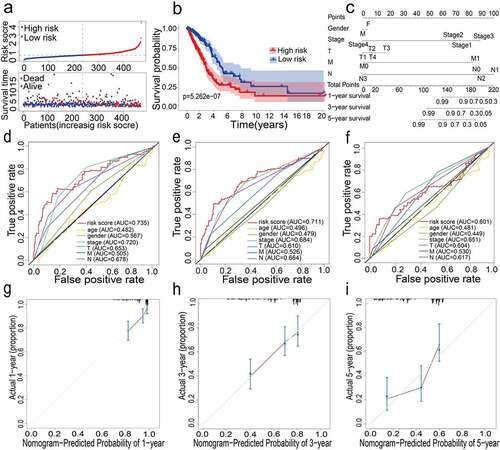
Figure 3. (a) Distribution of median of risk scores and OS status and risk score in GEO cohort. (b) Survival analysis of GEO high-risk group and low-risk group (P = 0.001). (c) Nomogram analysis results of GEO cohort. (d)(e)(f) AUC of time-dependent ROC curves in GEO cohort for 1 year, 3 years and 5 years. (g)(h)(i) Calibration curve for 1 year, 3 years and 5 years in GEO cohort
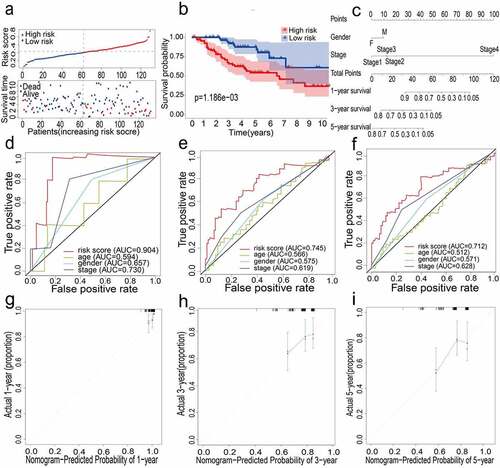
Table 3. Univariate and multivariate Cox analysis of the 12-gene prognostic signature and clinical risk factors
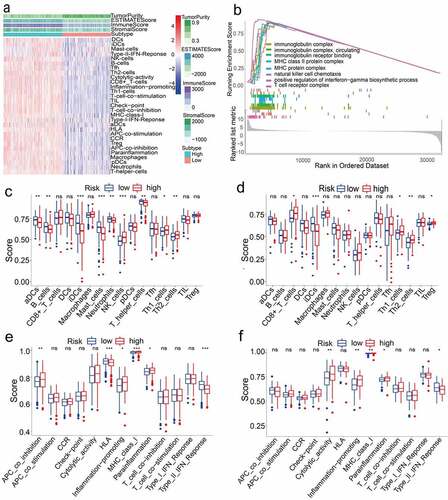
Figure 4. (a) Immune grouping results and tumor microenvironment heat map. Distribution of tumor purity, ESTIMATE score, immune score, and stromal score in high vs low immunity groups. (b) GO enrichment analysis results (P < 0.05). (c)(d)(e)(f) Results of immune cell scores and immune-related functions in TCGA and GEO groups