Figures & data
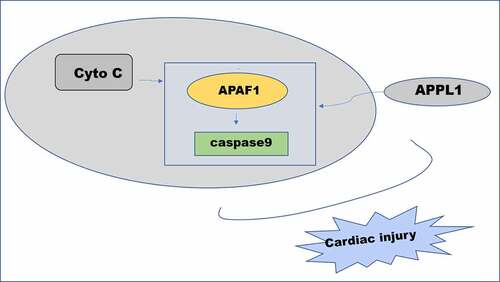
Figure 1. APPL1 expression level is low in myocardial ischemia tissues of mice. (Control: n = 6, H/R: n = 6) (a) The mRNA level of APPL1 in myocardial tissues was measured by Quantitative real-time PCR. (b) The APPL1 protein in myocardial tissues was determined by western blotting. (c) The pathological changes of myocardial tissues were observed by hematoxylin-Eosin (HE) staining. Error bars represent the mean ± SEM from three independent experiments. ***P < 0.001
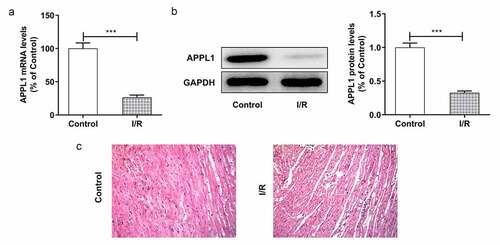
Figure 2. APPL1 was low expressed in H9C2 cells under H/R exposure (a) The mRNA level of APPL1 in myocardial ischemia cells was measured by Quantitative real-time PCR. (b) The APPL1 expression in myocardial ischemia cells was determined by western blotting. Error bars represent the mean ± SEM from three independent experiments. **P < 0.01, ***P < 0.001
Figure 3. APPL1 knockdown suppressed the viability of H9C2 cells under H/R exposure, and aggravated LDH secretion. (a) The mRNA level of APPL1 in H9C2 cells was measured by Quantitative real-time PCR. (b) The APPL1 expression in H9C2 cells was determined by western blotting. (c) The H9C2 cell viability was detected by CCK8 assay. (d) The LDH level was analyzed by commercial assay kit. Error bars represent the mean ± SEM from three independent experiments. **P < 0.01, ***P < 0.001
Figure 4. APPL1 knockdown aggravated hypoxia/reperfusion-induced inflammation in H9C2 cells. (a) The production of inflammatory cytokines including TNF-α, IL-1β and IL-6 was quantified with corresponding ELISA kit. (b) The expression levels of NF-κb p65 and Cox2 were determined by western blotting. Error bars represent the mean ± SEM from three independent experiments. **P < 0.01, ***P < 0.001
Figure 5. APPL1 knockdown aggravated hypoxia/reperfusion-induced apoptosis in H9C2 cells. (a-b) The H9C2 cell apoptosis was analyzed by TUNEL assay and quantification. (c) The expression levels of Bcl-2, Bax, cleaved PARP were determined by western blotting. Error bars represent the mean ± SEM from three independent experiments. **P < 0.01, ***P < 0.001
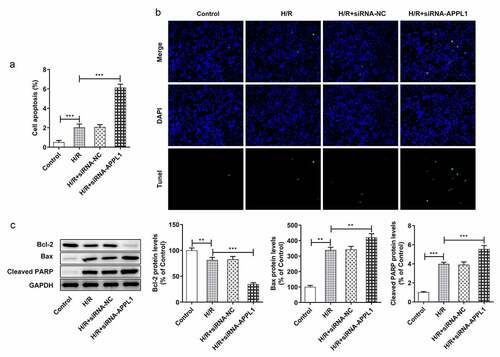
Figure 6. The effect of APPL1 on APAF-1/Caspase9 signaling pathway in H9C2 cells with H/R stimulation. (a) The expression levels of APAF-1, Cleaved caspase9/caspase9 were determined by western blotting. (b) The interaction between APPL1 and APAF-1/Caspase9 was verified by immunoprecipitation (IP). Caspase9 was immunoprecipitated (IP) from H9C2 cells exposed to H/R stimulation with or without siRNA-APPL1 transfection, and the immunoprecipitates or supernatant (Input) were immunoblotted for Caspase9 and APAF-1. (c) The mRNA level of APPL1 in H9C2 cells was measured by Quantitative real-time PCR. (d) The APPL1 expression in H9C2 cells was determined by western blotting. (e) The expression levels of APAF-1, Cleaved caspase9/caspase9 were determined by western blotting. Error bars represent the mean ± SEM from three independent experiments. *P < 0.05, **P < 0.01, ***P < 0.001
Figure 7. APAF1 inhibitor reversed the effect of APPL1 knockdown on viability and LDH secretion in H9C2 cells under H/R exposure. (a) The H9C2 cell viability was detected by CCK8 assay. (b) The LDH level was analyzed by commercial assay kit. Error bars represent the mean ± SEM from three independent experiments. *P < 0.05, **P < 0.01, ***P < 0.001
Figure 8. APAF1 inhibitor reversed the effect of APPL1 knockdown on inflammation and apoptosis in H9C2 cells under H/R challenge. (a) The expression levels of NF-κb p65 and Cox2 were determined by western blotting. (b) The expression levels of Bcl-2, Bax, cleaved PARP were quantified by western blotting. Error bars represent the mean ± SEM from three independent experiments. **P < 0.01, ***P < 0.001