Figures & data
Table 1. Clinicopathological features of cSCC patients enrolled in our study
Table 2. Primers in experiments
Figure 1. Clinical sample analysis. (a) MiR-320a expression in cSCC tissues and normal adjacent tissues. (b) ATG2B expression in cSCC tissues and normal adjacent tissues. (c) The link between miR-320a and ATG2B expression (Pearson correlation analysis). **P < 0.01, ***P < 0.001 versus the control group
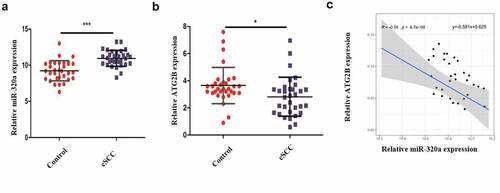
Figure 2. Crocin suppresses the proliferation of cSCC cells and induces their apoptosis. (a) MTT assay to evaluate cell viability. (b) Inhibition rate curve used for the determination of IC50 of crocin on the proliferation of A431 and SCL-1 cells treated with 1, 2 and 4 mM crocin for 48 h. (c) MTT assay to examine cell proliferation. (d) Western blots for cyclin D1 and cleaved caspase-3 expression. NS, non-significant, *P < 0.05, **P < 0.01, ***P < 0.001 versus the control group
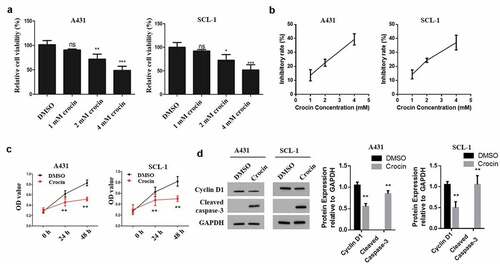
Figure 3. Crocin increases autophagy in cSCC cells. (a) Immunofluorescent staining assay for autophagy. (b) Western blots for BECN1 and LC3B. **P < 0.01 versus the control group
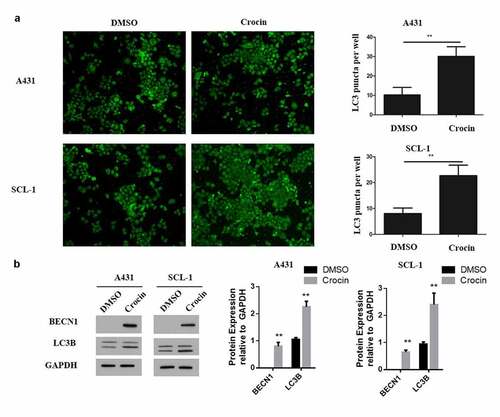
Figure 4. MiR-320a mediates autophagy and the apoptotic effects of crocin on cSCC cells. (a) MiR-320a expression in both cell lines following crocin treatment. (b) MiR-320a expression following transfection. (c) Western blots for BECN1, LC3B and cleaved caspase-3. **P < 0.01, ***P < 0.001 versus the control group
Figure 5. ATG2B expression is upregulated by crocin. (a) The illustration of the complementary sequence between miR-320a and ATG2B. (b) The luciferase activity in wild-type luciferase constructs. (c) The luciferase activity in mutant-type luciferase constructs. (d) ATG2B expression following miR-320a inhibitor transfection. NS, non-significant, *P < 0.05, **P < 0.01, ***P < 0.001 versus the control group
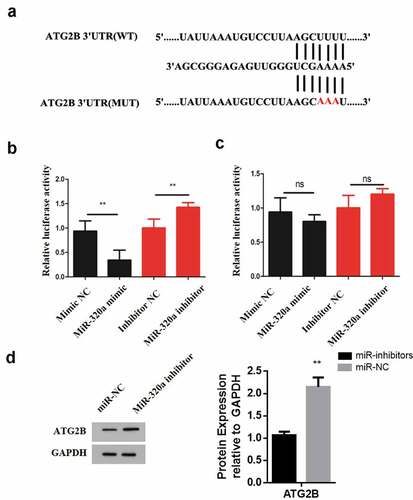
Figure 6. ATG2B expression is upregulated by crocin. (a) ATG2A mRNA expression. (b) Western blots for ATG2B. (c) ATG2A mRNA expression in both cell lines following si-ATG2B transfection. (d) Western blots for ATG2B and cleaved caspase-3. **P < 0.01, ***P < 0.001 versus the control group
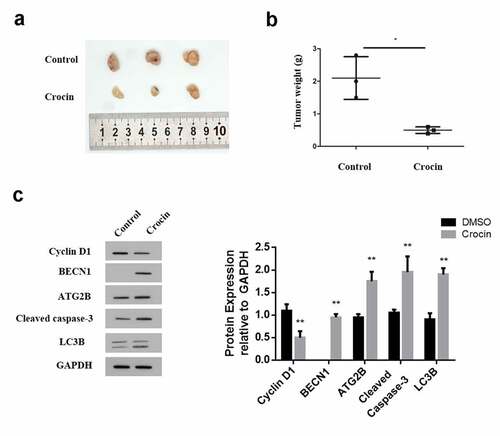
Figure 7. Crocin triggers the apoptosis in cSCC in vivo. (a) The illustration of tumors in animal experiments. (b) Tumor weight. (c) Western blots for cyclin D1, cleaved caspase-3, ATG2B, BECN1 and LC3B. *P < 0.05 versus the control group