
Figures & data
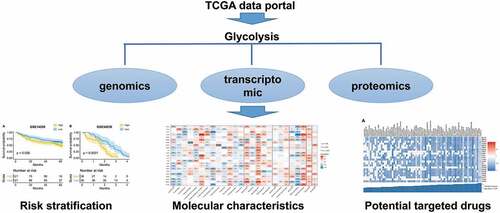
Table 1. Univariate cox analysis of glycolysis score
Table 2. Subgroup analysis for the prognostic value of glycolysis score
Figure 1. The prognostic value of glycolysis in pan-cancer patients
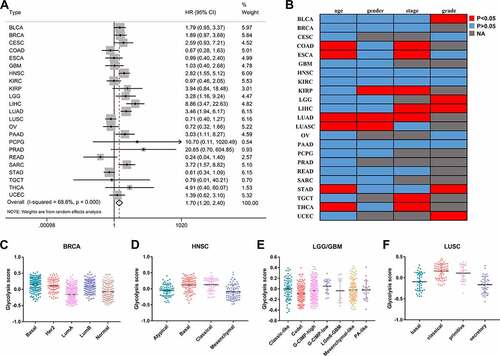
Figure 2. Validation of the prognostic value of hepatocellular carcinoma (HCC) in three independent cohorts
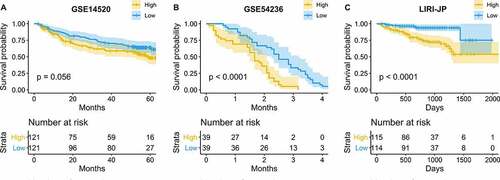
Figure 3. Exploration of metabolism-driven cancer types
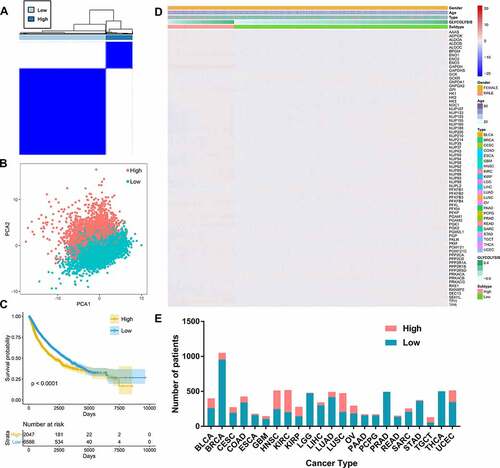
Figure 4. Associations between glycolysis and 10 oncogenic signaling pathway alterations
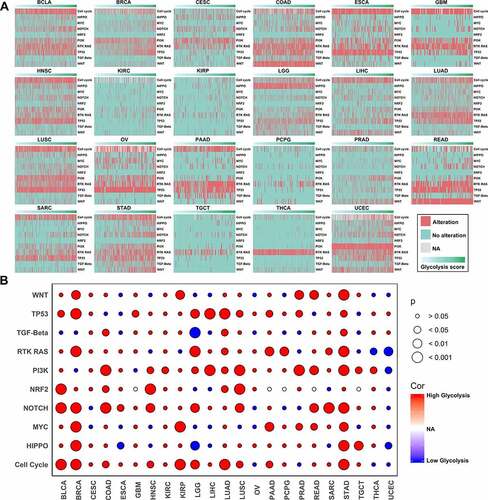
Figure 5. Gene functional enrichment analysis of glycolysis-associated genes
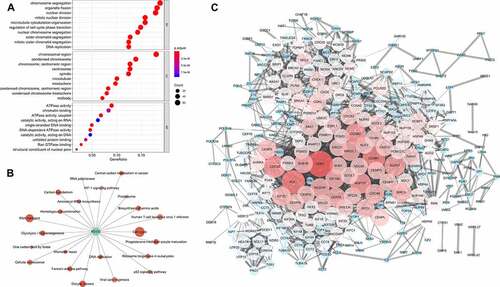
Figure 6. Correlation network of glycolysis-related proteins
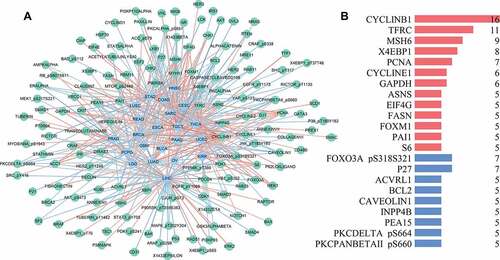
Figure 7. Associations between glycolysis and immune cell infiltrations
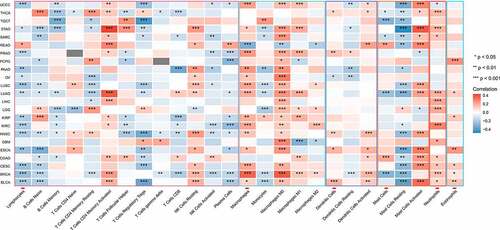
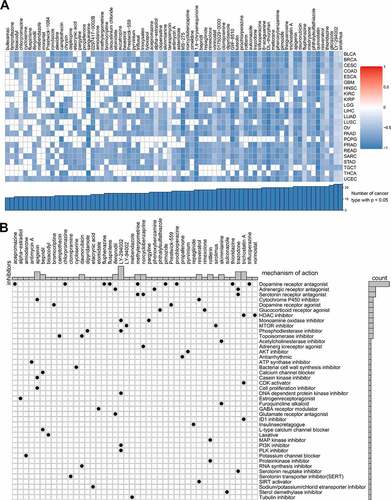
Figure 8. Correlation of glycolysis with drug resistance: connectivity map analysis
Data availability statement
The datasets analyzed in this study were obtained from the TCGA database (http://www.cancer.gov/tcga).