Figures & data
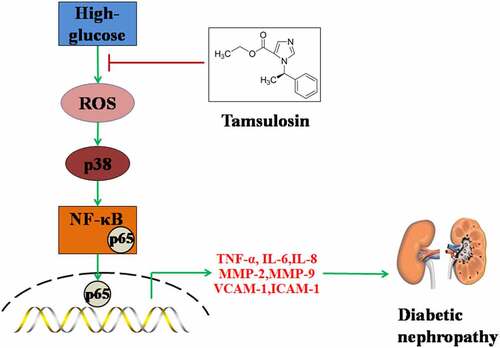
Figure 1. The effects of Tamsulosin on the morphology of high glucose-stimulated human GECs. (a). The structure of Tamsulosin; (b). Cells were stimulated with high glucose (25 mM) in the presence or absence of Tamsulosin (25, 50 nM) for 24 hours. Morphology of GECs; (c). Cell viability of GECs (***, P < 0.005 vs. vehicle group; ##, ###, P < 0.05, 0.01 vs. high glucose group, N = 6)
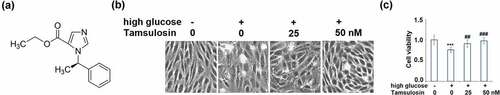
Figure 2. Tamsulosin attenuated high glucose-induced expression of pro-inflammatory cytokines in human glomerular endothelial cells (GECs). (a). mRNA of IL-6, TNF-α, IL-8; (b). Secretions of IL-6, TNF-α, and IL-8 (***, P < 0.005 vs. vehicle group; ##, ###, P < 0.05, 0.01 vs. high glucose group, N = 5)
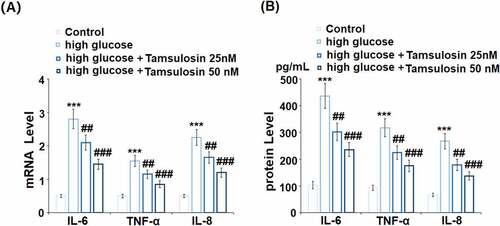
Figure 3. Tamsulosin alleviated high glucose-induced expressions of MMP-2 and MMP-9. (a). mRNA of MMP-2 and MMP-9; (b). Protein of MMP-2 and MMP-9 (***, P < 0.005 vs. vehicle group; ##, ###, P < 0.05, 0.01 vs. high glucose group, N = 4–5)
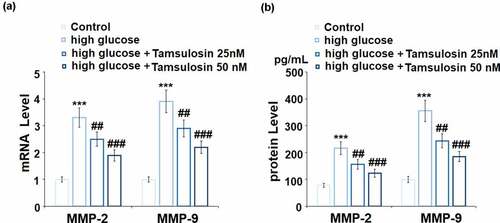
Figure 4. Tamsulosin prevented high glucose-induced expression of VCAM-1 and ICAM-1 in human glomerular endothelial cells (GECs). (a). mRNA of VCAM-1 and ICAM-1; (b). Protein of VCAM-1 and ICAM-1 (***, P < 0.005 vs. vehicle group; ##, ###, P < 0.05, 0.01 vs. high glucose group, N = 4)
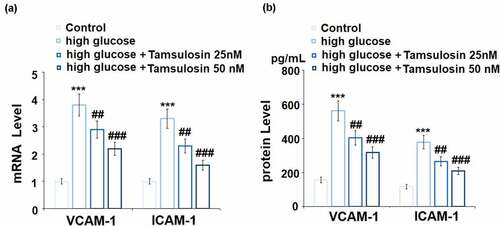
Figure 5. Tamsulosin inhibited high glucose-induced expression of fibrosis factors. (a). mRNA of Col-1 and TGF-β1; (b). Protein levels of Col-1 and TGF-β1 (***, P < 0.005 vs. vehicle group; ##, ###, P < 0.05, 0.01 vs. high glucose group, N = 4)
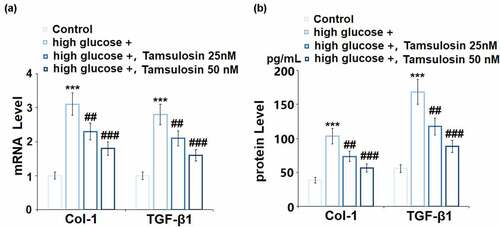
Figure 6. Tamsulosin ameliorated high glucose-induced production of mitochondrial ROS and activation of p38. (a). Mitochondrial ROS; (b). Levels of phosphorylated p38 and total p38 were measured (***, P < 0.005 vs. vehicle group; ##, ###, P < 0.05, 0.01 vs. high glucose group, N = 4–5)
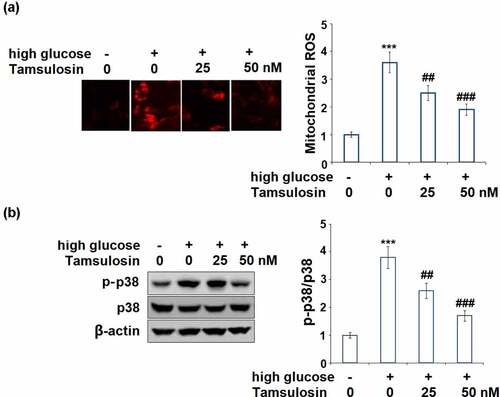
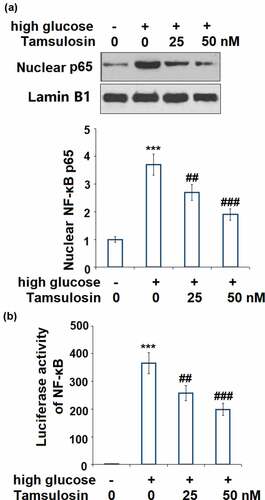
Figure 7. Tamsulosin suppressed high glucose-induced activation of NF-κB. (a). Nuclear level of NF-κB p65; (b). Luciferase activity of NF-κB (***, P < 0.005 vs. vehicle group; ##, ###, P < 0.05, 0.01 vs. high glucose group, N = 5)