Figures & data
Figure 1. Histogram of the summary characteristics of all subjects. †CTSCI, complete thoracic spinal cord injury; ITSCI, incomplete thoracic spinal cord injury; HC, healthy control. ALT, alanine aminotransferase; GLU, fasting blood glucose; TCHO, serum total cholesterol; LDL, low-density lipoprotein; UA, uric acid; TG, triglyceride; UREA, serum urea; TBIL, total bilirubin; CR, creatinine; AST, aspartate aminotransferase; HDL, high-density lipoprotein; ALB, albumin; TP, total protein; BMI, body mass index
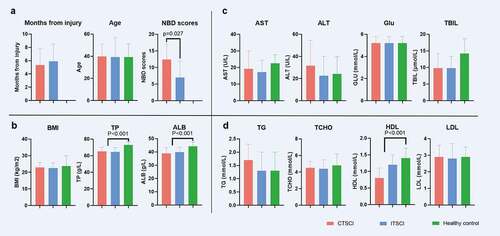
Figure 2. Diversity of gut microbiota among healthy individuals, patients with CTSCI, and ITSCI. (a) Box plot depicting the alpha diversity: observed OTUs, Shannon index, Faith’s phylogenetic diversity, and Pielou’s evenness. (b) PCoA plot depicting the beta diversity based on the Bray-Curtis distance metric. (c) Box plot of the beta diversity, there is a significant difference between the ITSCI and CTSCI groups individually when compared against the healthy cohort *0.01 < P < 0.05 and **p < 0.01. †CTSCI, complete thoracic spinal cord injury; ITSCI, incomplete thoracic spinal cord injury; HC, healthy control
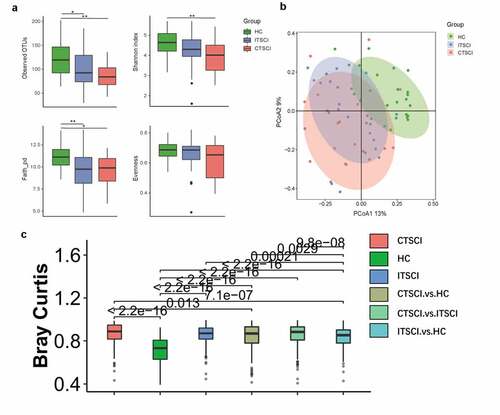
Figure 3. Cladogram showing differentially abundant gut microbiota among healthy individuals and patients with CTSCI and ITSCI. (a) LEfSe cladogram between healthy individuals and patients with CTSCI. (b) LEfSe cladogram between healthy individuals and patients with ITSCI. (c) LEfSe analysis between patients with CTSCI and ITSCI. †CTSCI, complete thoracic spinal cord injury; ITSCI, incomplete thoracic spinal cord injury; HC, healthy control
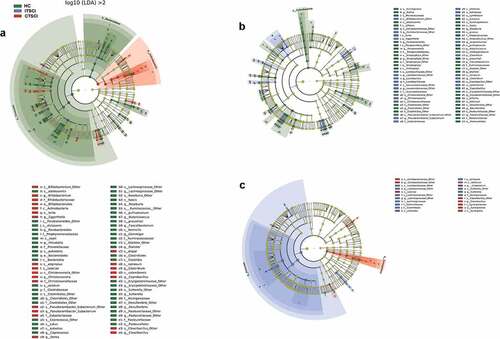
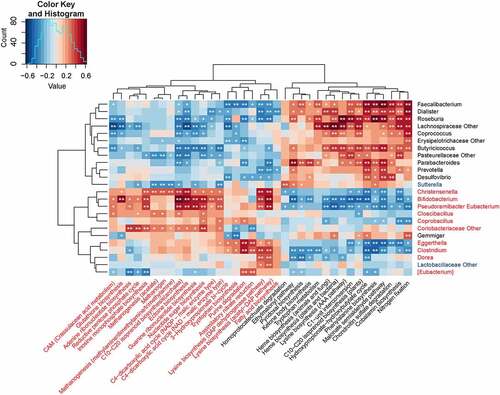
Figure 4. Correlation heat map analysis of different serum biomarkers between SCI-associated genera. *0.01 < P < 0.05 and **P < 0.01. †SCI, spinal cord injury; HC, healthy control; ALT, alanine aminotransferase; GLU, fasting blood glucose; TCHO, serum total cholesterol; LDL, low-density lipoprotein; UA, uric acid; TG, triglyceride; UREA, serum urea; TBIL, total bilirubin; CR, creatinine; AST, aspartate aminotransferase; HDL, high-density lipoprotein; ALB, albumin; TP, total protein
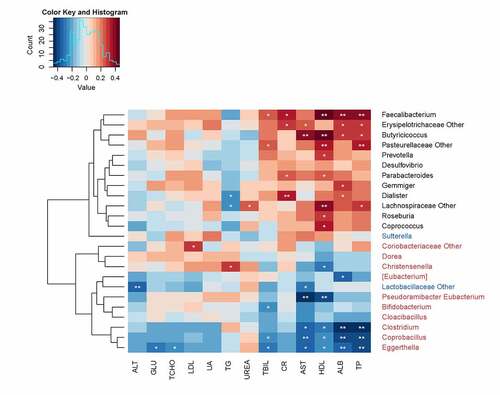
Figure 5. Correlation heat map analysis of 37 most abundant KEGG modules exhibiting significant difference between SCI-associated genera. The correlation effect is indicated through a color gradient from blue (negative correlation) to red (positive correlation). *0.01 < P < 0.05 and **P < 0.01. †SCI, spinal cord injury