Figures & data
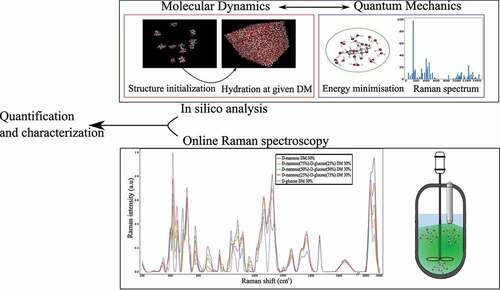
Figure 1. D-glucose and D-mannose structure equilibrium occurring in aqueous solution
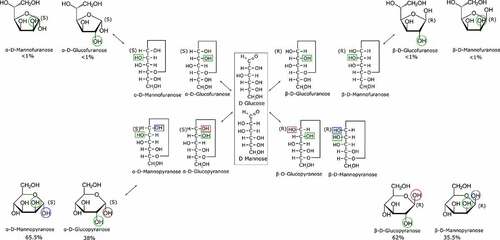
Figure 2. Schematic representation of the structure algorithm used to select the final structure
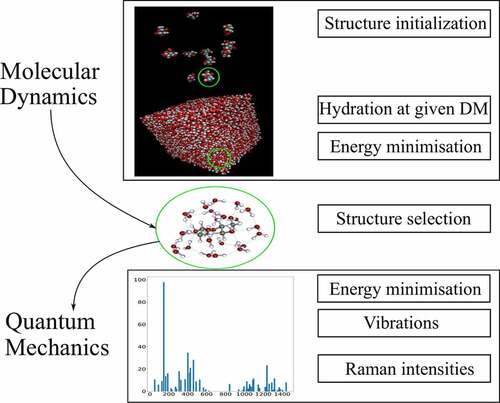
Table 1. Raman frequencies for aqueous solution of selected monosaccharides D-glucose, D-mannose and the 50% D-mannose and D-glucose mixture at 30 DM. s-strong, m – medium, w – weak, ν stretching, δ bending, ώ wagging
Figure 3. Raman spectra of pure D-glucose D-mannose and the corresponding mixtures of 25%-75%, 50%-50%, 75%-25% ratio of D-mannose and D-glucose in aqueous solution. Every spectrum has a fixed 30% DM
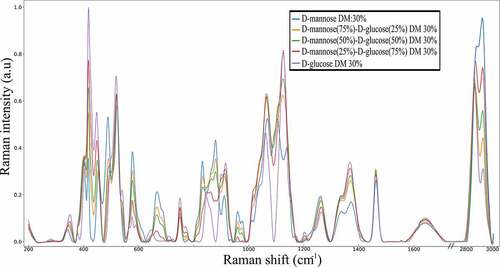
Figure 4. Graphical representation of the relationship between the raw surface area obtained using a deconvolution methodology with Gaussian and Lorentzian profiles and the intensity of Raman apex and the D-mannose dry matter in aqueous solution
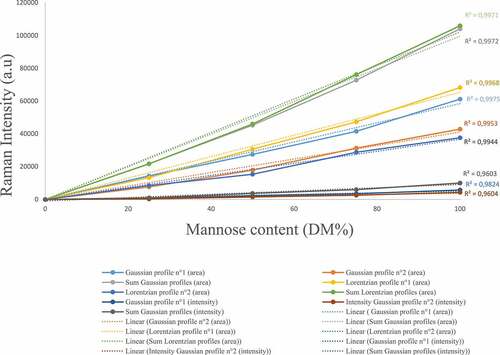
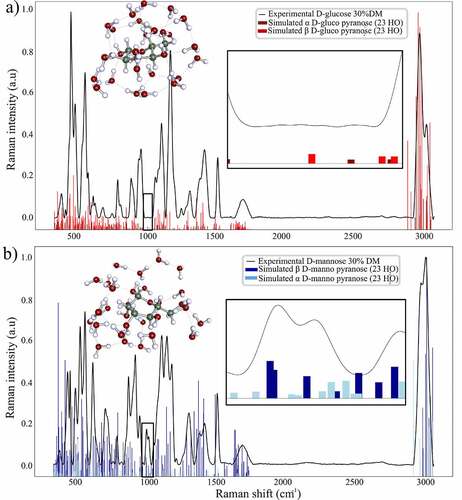
Figure 5. Simulated vibrational frequencies and Raman intensities of and
pyranose form of D-glucose and D-mannose resulting from molecular dynamics and quantum mechanics energy minimization algorithm expressed versus the corresponding experimental Raman spectrum of the pure compound in aqueous solution at 30%DM