
Figures & data
Figure 1. Overall workflow of this study
Table 1. Available clinical and pathologic factors of the cohorts used in this study
Table 2. Information of the 11 immune-related gene pairs and their coefficient
Figure 2. Predictor selection by the LASSO
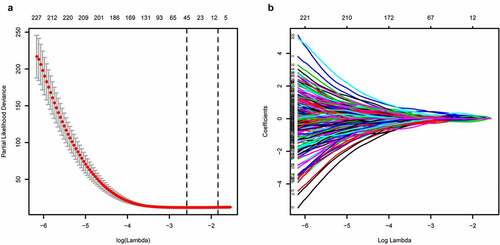
Figure 3. Survival plot of the three cohorts
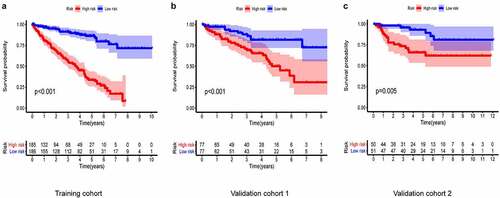
Figure 4. 1, 3, and 5 year ROC curve of the three cohorts
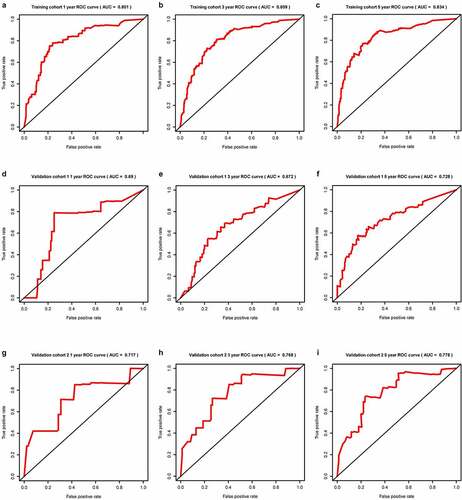
Figure 5. Univariate and multivariate Cox regression analysis forest plot of training cohort
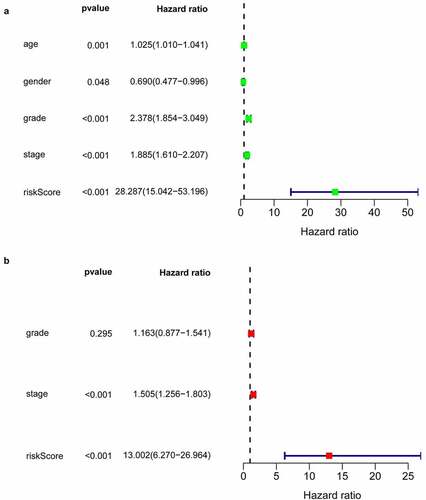
Figure 6. Univariate and multivariate Cox regression analysis forest plot of validation cohort 1
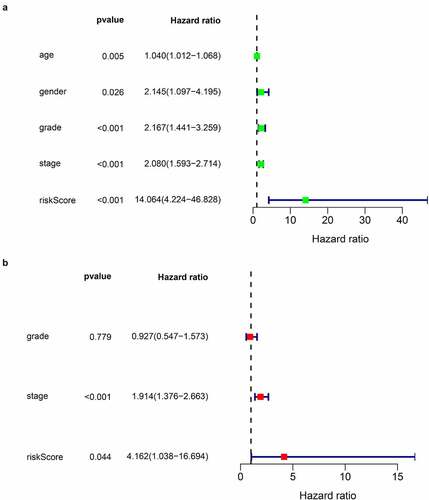
Figure 7. Univariate and multivariate Cox regression analysis forest plot of validation cohort 2
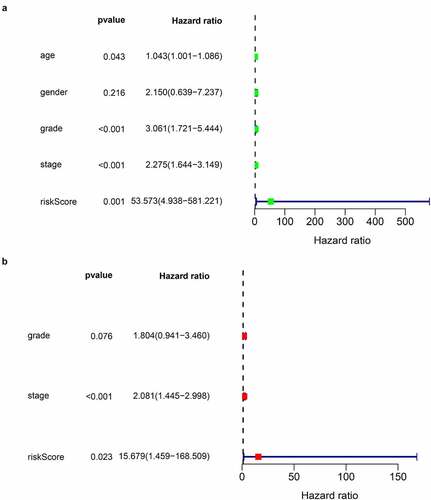
Figure 8. IRGP score in different clinicopathological factors
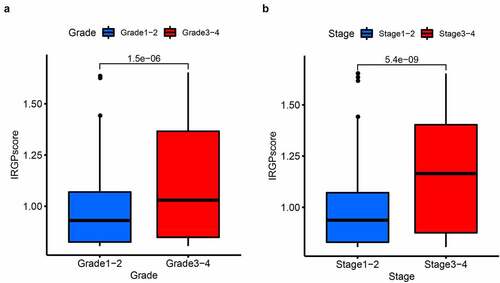
Figure 9. Nomogram model constructed by riskscore and stage predicting 1, 3 and 5 year OS for ccRCC patients

Figure 10. Calibration curve of nomogram model
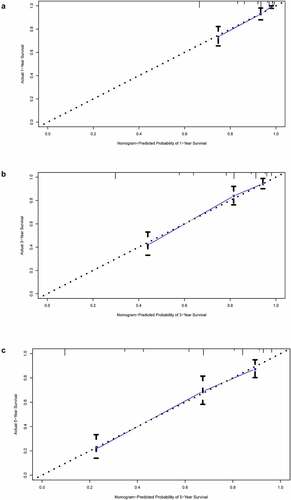
Figure 11. 1, 3, and 5-year ROC curve of the three cohorts
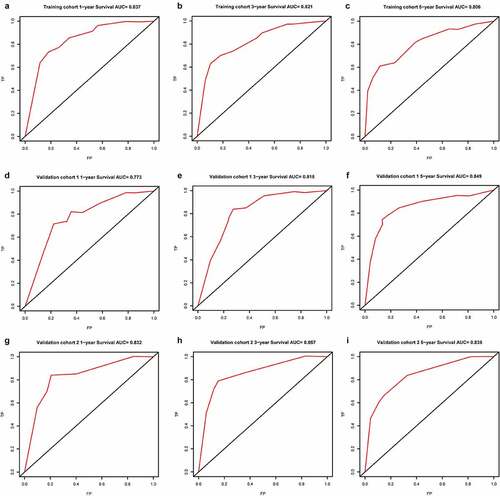
Figure 12. Survival plot of the three cohorts
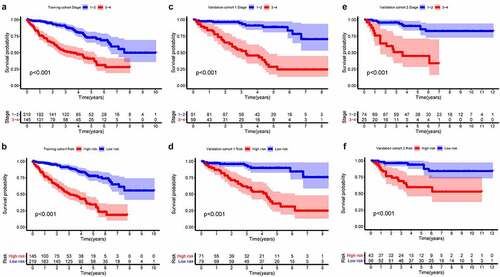
Figure 13. Immune infiltration status of training cohort
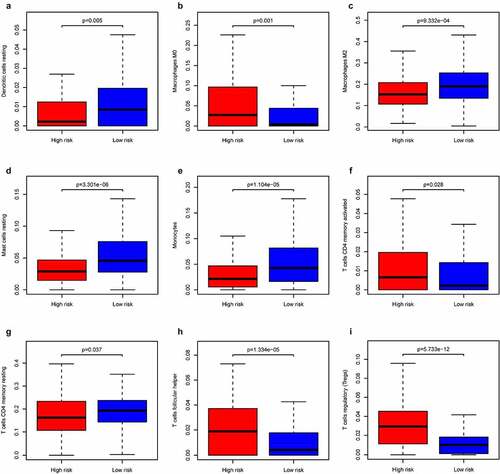
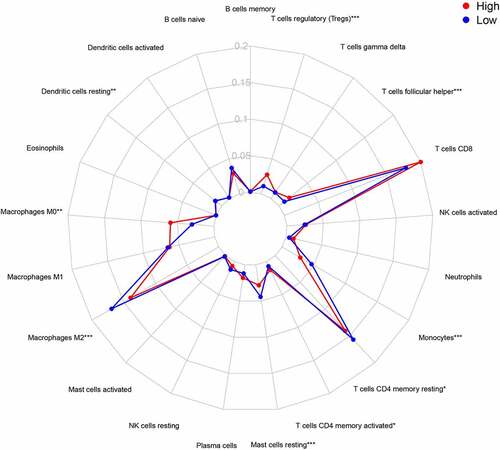
Figure 14. Summary of the 21 immune cells’ abundance for different risk groups of training cohort
Data accessibility
The expression and clinical information data used to support the findings of this study have been deposited in the TCGA (https://portal.gdc.cancer.gov/) and Arrayexpress(https://www.ebi.ac.uk/arrayexpress/) repository. The immune-related genes list was achieved from the Immport Shared Gene Lists Data(https://www.immport.org/home). The data of all the above databases can be downloaded freely, and our research complied with the agreement of these databases.