Figures & data
Figure 1. Cytotoxicity of naproxen in HUVECs. Cells were stimulated with naproxen at the concentrations of 1, 5, 10, 50, 100, and 500 μM for 24 h. (a). Molecular structure of naproxen; (b). Cell viability of HUVECs was measured using CCK-8 kit (#, ##, ###, P < 0.05, 0.01, 0.005 vs. vehicle group)
Figure 2. Naproxen prevents IL-1β-induced LDH release in HUVECs. Cells were incubated with IL-1β (10 ng/mL) with or without naproxen (5, 10 μM) for 24 h. (a). Morphology of HUVECs in different culture conditions; (b). LDH release was measured using a commercial kit (###, P < 0.005 vs. vehicle group; *, **, P < 0.05, 0.01 vs. IL-1β group)
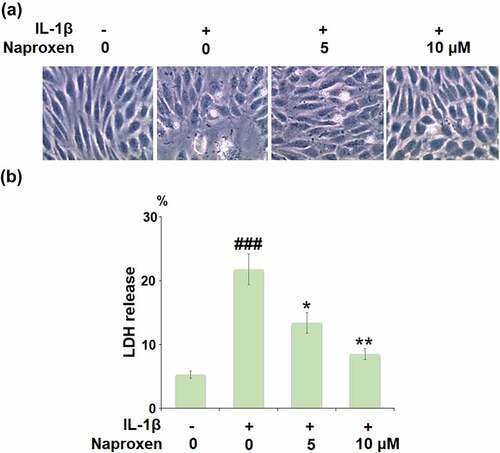
Figure 3. Naproxen suppresses IL-1β-induced expression of pro-inflammatory cytokines in HUVECs. Cells were incubated with IL-1β (10 ng/mL) with or without naproxen (5, 10 μM) for 24 h. (a). mRNA of IL-6 (1, 6.5, 4.6, 3.5); (b). mRNA of IL-12; (c). mRNA of TNF-α; (d). Secretions of IL-6; (e). Secretions of IL-12; (f). Secretions of TNF-α (###, P < 0.005 vs. vehicle group; *, **, P < 0.05, 0.01 vs. IL-1β group)
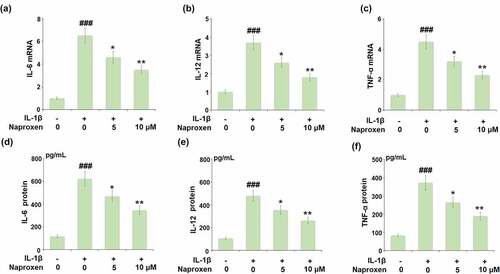
Figure 4. Naproxen inhibits IL-1β-induced expression of VEGF and tissue factor (TF) in HUVECs. Cells were incubated with IL-1β (10 ng/mL) with or without naproxen (5, 10 μM) for 24 h. (a). mRNA of VEGF; (b). mRNA of TF; (c). Production of VEGF; (d). Production of TF (###, P < 0.005 vs. vehicle group; *, **, P < 0.05, 0.01 vs. IL-1β group)
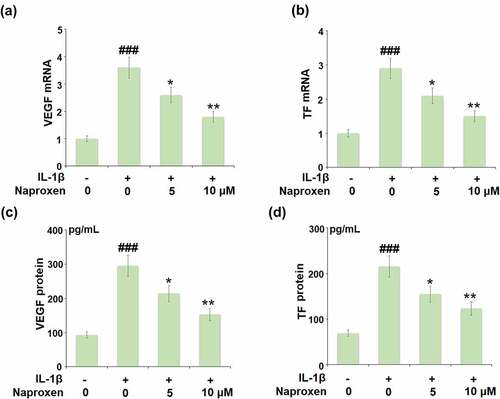
Figure 5. Naproxen reduces IL-1β-induced expression of ICAM-1 and E-selectin. Cells were incubated with IL-1β (10 ng/mL) with or without naproxen (5, 10 μM) for 24 h. (a). mRNA of ICAM-1; (b). mRNA of E-selectin; (c). Production of ICAM-1; (d). Production of E-selectin (###, P < 0.005 vs. vehicle group; *, **, P < 0.05, 0.01 vs. IL-1β group)
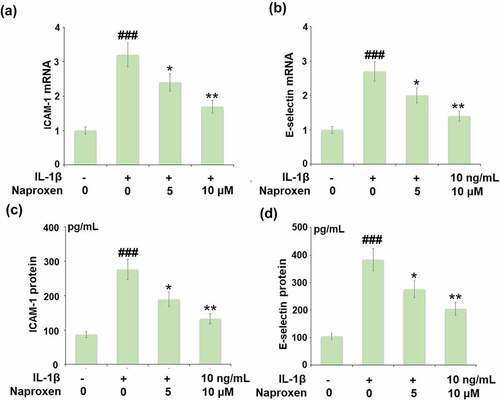
Figure 6. Naproxen prevents IL-1β-induced attachment of THP-1 monocytes to HUVECs. Cells were incubated with IL-1β (10 ng/mL) with or without naproxen (5, 10 μM) for 24 h. Attachment of THP-1 monocytes to HUVECs was measured using Calcein-AM staining (###, P < 0.005 vs. vehicle group; *, **, P < 0.05, 0.01 vs. IL-1β group)
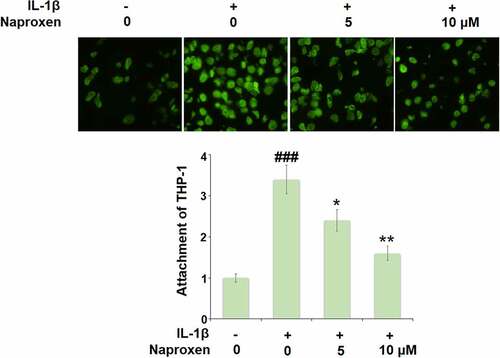
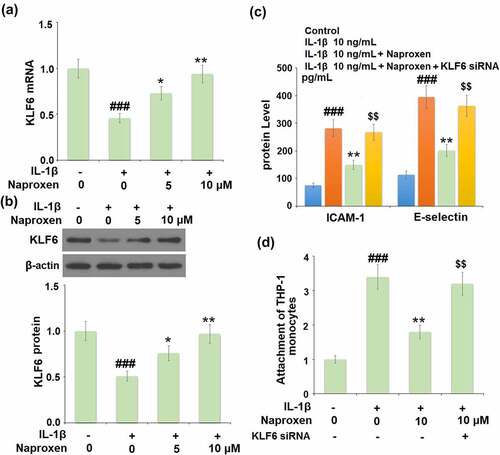
Figure 7. The protective effects of naproxen against IL-1β-induced attachment of THP-1 monocytes to HUVECs are dependent on KLF6. (a-b). Cells were incubated with IL-1β (10 ng/mL) with or without naproxen (5, 10 μM) for 24 h. mRNA and protein levels of KLF6 were measured; (c-d). Cells were transfected with KLF6 siRNA, followed by stimulation with IL-1β (10 ng/mL) with or without naproxen (10 μM) for 24 h. Production of ICAM-1 and E-selectin was measured by ELISA. Attachment of THP-1 monocytes to HUVECs was measured using Calcein-AM staining (###, P < 0.005 vs. vehicle group; **, P < 0.01 vs. IL-1β group; $$, P < 0.01 vs. IL-1β+ IL-1β group)