Figures & data
Figure 1. Identification of molecular subtypes of gastric cancer. A: Consistent clustering of glycolysis and cholesterol genes. B: Samples were classified into four subtypes according to glycolysis and cholesterol gene expression levels (Quiescent, Glycolysis, Cholesterol and Mixed). C: Disease-specific survival time prognostic survival curves of the four molecular subtypes. D: Disease-specific survival time prognostic survival curves of the Cholesterol and Glycolysis subtypes. E: Heatmaps of 24 Cholesterol- and Glycolysis-related genes. F: Glycolysis Genes expression levels in four subtypes and normal groups in the TCGA dataset. G: Cholesterol Genes expression levels in four subtypes and normal groups in the TCGA dataset
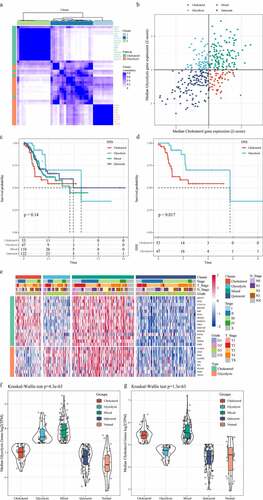
Figure 2. Mutant molecular events in four subtypes. A: Heat map analysis of mutations of 13 molecules in four subtypes. B: CNV distribution of TP53, CTNNB1 and MYC in four subtypes
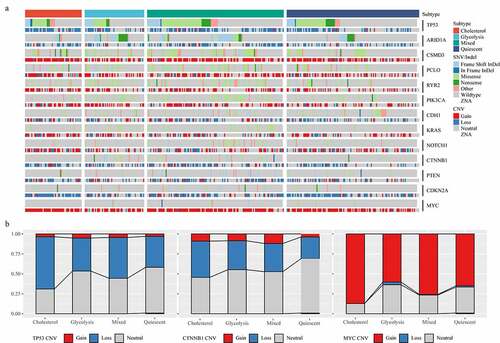
Figure 3. MPC complex as a potential regulator of tumor glycolysis-cholesterol synthesis axis. A: MPC1 is mainly CNV deletion in metabolic subtypes, while MPC2 is mainly CNV amplification in metabolic subtypes. B: The expressions of MPC1 and MPC2 in the four subtypes. C: Spearman correlation coefficient analysis showed positive and negative correlation with MPC1/2 genes, respectively
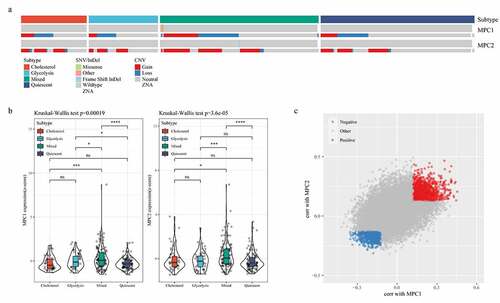
Figure 4. Analysis of clinical features in subtypes. A: Analysis of Age in four subtypes. B: Analysis of Gender in four subtypes. C: Analysis of Grade in four subtypes. D: Analysis of T stage in four subtypes. E: Analysis of N stage in four subtypes. F: Analysis of M stage in four subtypes
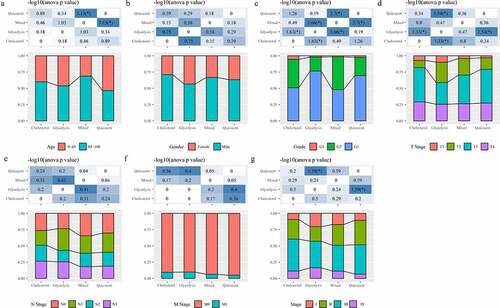
Figure 5. Analysis of and immune score in subtypes. A: Distribution of StromalScore in four subtypes. B: Distribution of ImmuneScore in four subtypes. C: PDCD1 expression of in four subtypes. D: CTLA4 expression of in four subtypes
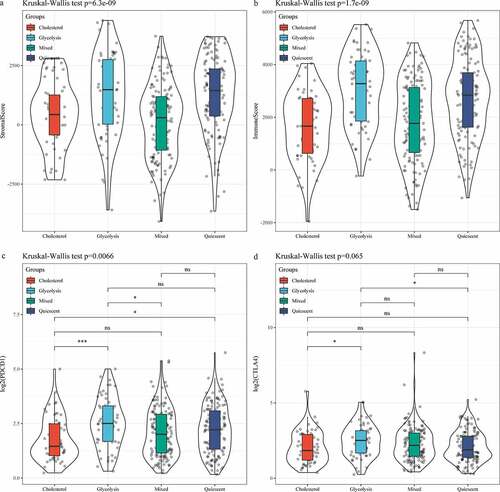
Figure 6. Identification of differentially expressed genes. A: A total of 1966 differentially expressed genes, of which 302 are up-regulated and 1664 are down-regulated. B: 100 most expressed genes were selected for heatmap
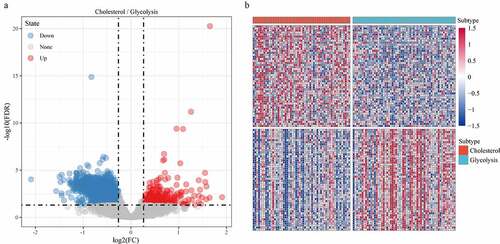
Figure 7. Functional enrichment analysis of differentially expressed genes. A: Pathways annotated on BP for up-regulated expressed genes. B: Pathways annotated on CC for up-regulated expressed genes. C: Pathways annotated on MF for up-regulated expressed genes. D: Pathways annotated on KEGG for up-regulated expressed genes. E: Pathways annotated on BP for down-regulated expressed genes. F: Pathways annotated on CC for down-regulated expressed genes. G: Pathways annotated on MF for down-regulated expressed genes. H: Pathways annotated on KEGG for down-regulated expressed genes
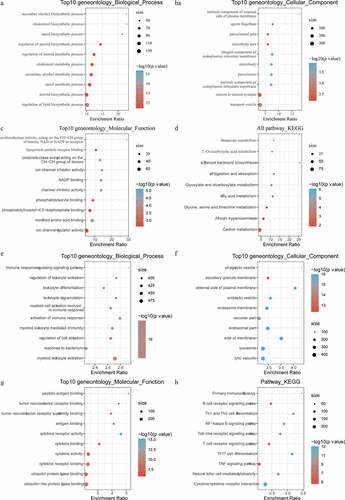
Figure 8. GSEA enrichment analysis in the Cholesterol and Glycolysis group
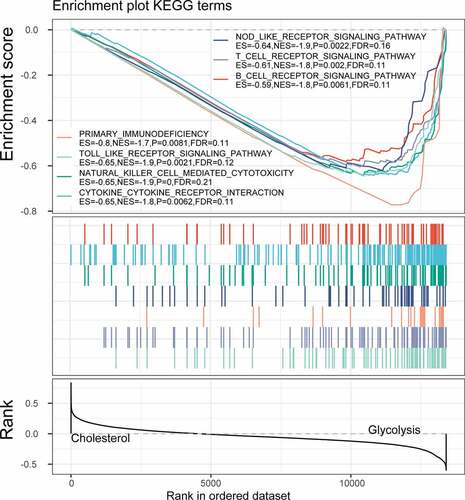
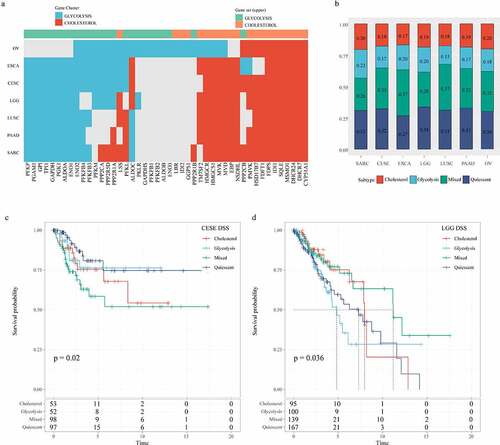
Figure 9. Correlation analysis of glycolysis and cholesterol gene clusters with pan-cancer types. A: Clusters of co-expression pathway-specific genes in seven cancer types (OV, ESCA, CESE, LGG, LUSC, PAAD, SARC). B: The seven cancer types are also classified into four metabolic subtypes according to the clustering glycolysis and cholesterol gene expression levels. C: Disease-specific survival time prognostic survival curves of the four molecular subtypes in CESE. D: Disease-specific survival time prognostic survival curves of the four molecular subtypes in LGG