
Figures & data
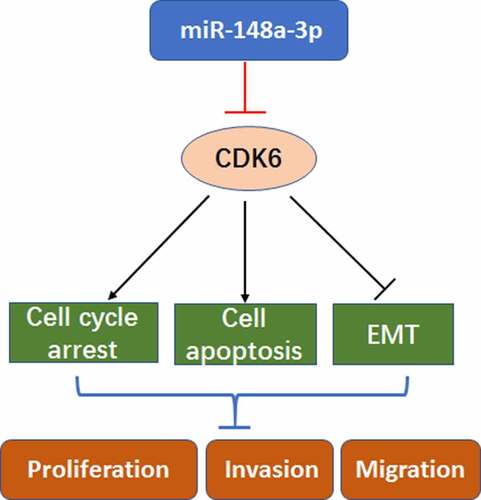
Figure 1. Screening the differential expression of miRNAs in AML. A: Differential analysis of miRNAs with red for up-regulated miRNAs and green for down-regulated miRNAs; B: Analysis of miR-148a-3p level in the GSE142700 data set; C: qRT-PCR was used to measure miR-148a-3p levels in human leukemia cell lines and bone marrow mesenchymal stem cells, and HS5 cells were considered as control. *P < 0.05, **P < 0.01
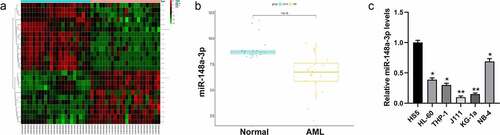
Figure 2. Effect of miR-148a-3p on the proliferation of AML cells. A: J111 and KG-1a cells were transfected with miR-NC or miR-148a-3p mimics for 48 h, and miR-148a-3p level was measured by qRT-PCR; B: CCK-8 assay detected cell proliferation; C: Cell clone formation experiment was conducted to measure cell proliferation; Compared with miR-NC, *P < 0.05, **P < 0.01
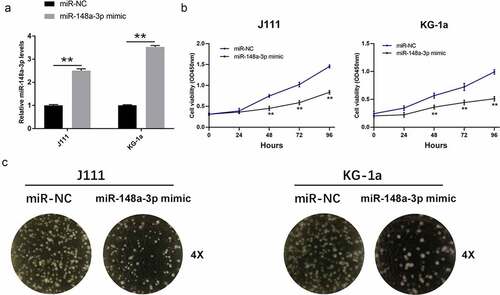
Figure 3. The effect of miR-148a-3p on the cell cycle progression, apoptosis, invasion and migration of AML cells. A: J111 and KG-1a cells were transfected with miR-NC or miR-148a-3p mimics for 48 h, flow cytometry was used to analyze the cell cycle. B: The percentage of each cell cycle phase were statistic with chart. C: Cyclin D1, p21 and GAPDH were detected with Western blot. D: Flow cytometry were used to analyze the cell apoptosis. E: Cleaved PARP, Cleaved caspase-3, pre-caspase-3 and GAPDH were detected with Western blot. F: Transwell was applied to detect the cell invasion and migration. G: Vimentin, E-cadherin and GAPDH were measured with Western blot. Compared with miR-NC, *P < 0.05, **P < 0.01
Figure 4. Analysis of the direct target gene of miR-148a-3p. A: Differential analysis of mRNAs with red for up-regulated mRNAs and green for down-regulated mRNAs; B: Analyzed miR-148a-3p potential target genes; C: Screened the target genes that negatively regulated by miR-148a-3p. Red for up-regulation, green for down-regulation, triangle for miRNA, and circle for mRNA; D: wt CDK6 or mt CDK6 reporter plasmid and miR-NC or miR-148a-3p mimics were co-transfected with J111 and KG-1a cells for 48 h, and DLR experiment was conducted to measure the luciferase activity; E: miR-148a-3p mimics or miR-NC was co-transfected with J111 and KG-1a cells for 48 h, qRT-PCR and Western blot measured CDK6 mRNA and protein expressions; F: miR-148a-3p inhibitor or inhibitor-NC was transfected into J111 and KG-1a cells for 48 h, and CDK6 mRNA and protein expressions were detected by qRT-PCR and Western blot. Compared with miR-NC, **P < 0.01
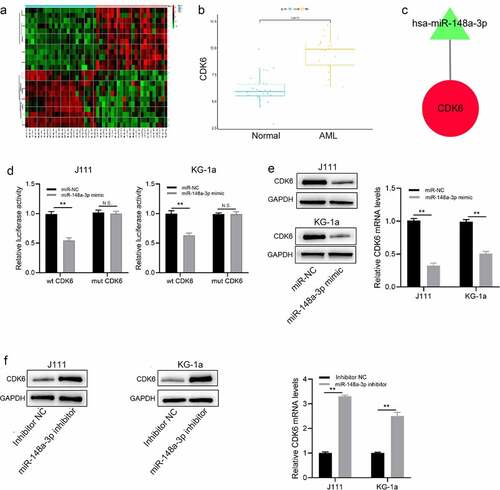
Figure 5. Effect of CDK6 overexpression on the proliferation of J111 and KG-1a cells which transfected with miR-148a-3p mimics. A: The CDK6 overexpression plasmid or control plasmid was co-transfected with miR-148a-3p mimics or miR-NC in AML cells for 48 hours, then CDK6 mRNA and protein expressions were conducted by qRT-PCR and Western blot; B: CCK-8 assay was used to detect the cell viability. C: cell clone formation experiment of J111 and KG-1a cells; D: Cell cycle arrest assay and related protein expression in J111 and KG-1a cells. E: cell apoptosis ratio and related protein expression in J111 and KG-1a cells. Compared with miR-NC, *P < 0.05, **P < 0.01
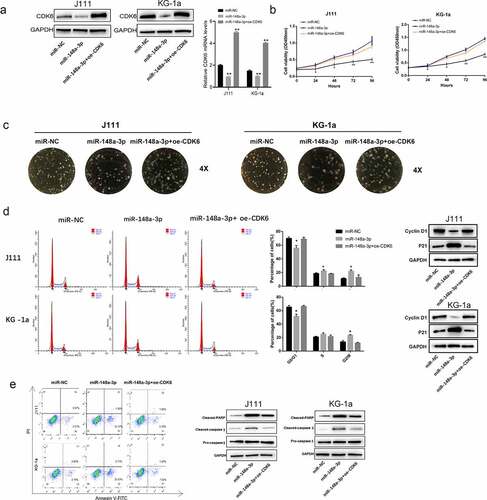
Figure 6. Effect of CDK6 overexpression on the invasion and migration in AML cells which transfected with miR-148a-3p mimics. A: CDK6 overexpression plasmid or control plasmid was co-transfected with miR-148a-3p mimics or miR-NC for 48 h, and Transwell was used to measure the cell invasion and cell migration; B: Invasion and migration related protein expression was measured by Western blot. Compared with miR-NC, *P < 0.05
Availability of data and material
The datasets used and/or; analyzed during the current study are available from the corresponding author on reasonable request.