
Figures & data
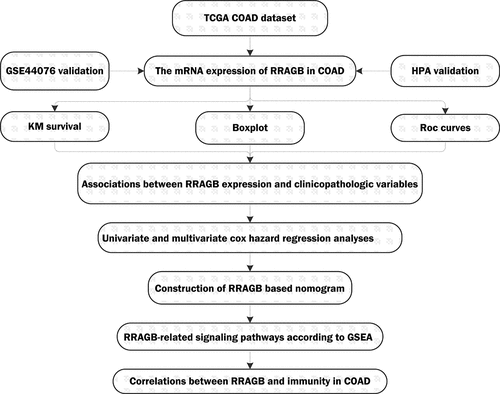
Figure 1. The expression levels of RRAGB in COAD tissues; (a) The mRNA expression levels of RRAGB in pan-cancers from the TCGA database; (b) The RRAGB mRNA expression by boxplot in COAD from TCGA (N = 39; T = 398); (c) The RRAGB mRNA expression by pairwise boxplot in COAD from TCGA (N = 39; T = 39); (d) K–M survival analysis of RRAGB in COAD from TCGA; (e) ROC curves and 1-, 3-, and 5-year AUCs of RRAGB in COAD from TCGA; (f-g) The protein expression levels of RRAGB by immunohistochemical staining from the HPA database; *P < 0.05; **P < 0.01; ***P < 0.001
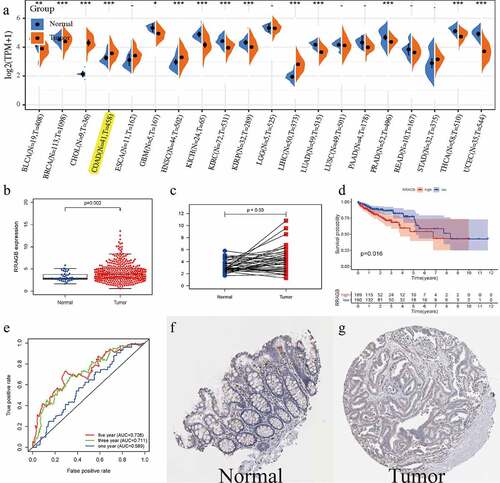
Figure 2. Associations between RRAGB expression and clinicopathologic variables; (a) Associations between RRAGB mRNA expression and age; (b) Associations between RRAGB mRNA expression and gender; (c) Associations between RRAGB mRNA expression and race; (d) Associations between RRAGB mRNA expression and stage; (e) Associations between RRAGB mRNA expression and T stage; (f) Associations between RRAGB mRNA expression and N stage; (g) Associations between RRAGB mRNA expression and M stage
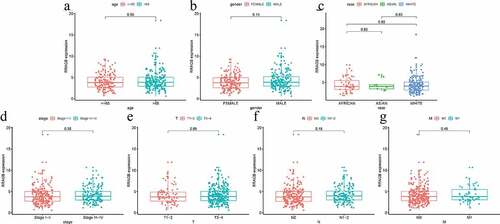
Figure 3. Univariate and multivariate cox hazard regression analyses; (a) Univariate Cox hazard regression analysis of eight clinicopathological variables (RRAGB, age, gender, race, stage, T, N, M) in COAD from TCGA dataset; (b) Multivariate Cox hazard regression analysis of eight clinicopathological variables (RRAGB, age, gender, race, stage, T, N, M) in COAD from TCGA dataset
Table 1. Univariate and multivariate cox hazard regression analyses of COAD in TCGA
Figure 4. RRAGB based nomogram and evaluation; (a) Nomogram based on eight clinicopathological variables (RRAGB, age, gender, race, stage, T, N, M) in COAD from TCGA dataset; (b) 1-year calibration curve; (c) 3-year calibration curve; (d) 5-year calibration curve
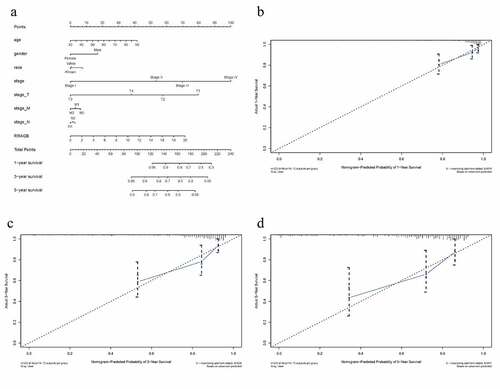
Table 2. C-index and 1-, 3-, 5-year AUCs of RRAGB-based nomogram
Figure 5. Gene set enrichment analysis (GSEA) results based on the RRAGB mRNA expression in COAD from TCGA dataset; (a) Significantly enriched pathway of Erbb signaling pathway; (b) Significantly enriched pathway of Insulin signaling pathway; (c) Significantly enriched pathway of Wnt signaling pathway; (d) Significantly enriched pathway of Ubiquitin mediated proteolysis; (e) Significantly enriched pathway of Basal transcription factors; (f) All of these five significantly enriched signaling pathways
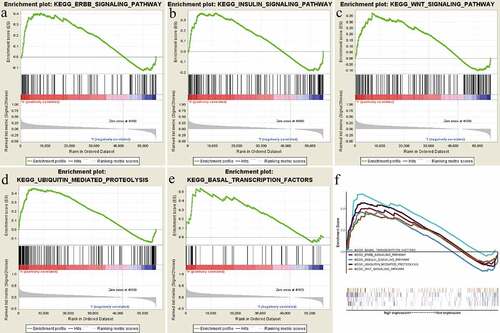
Table 3. Gene set enrichment analysis results
Figure 6. Associations between RRAGB and PPI network, MSI, TNB, TMB in COAD; (a) PPI network based on RRAGB expression; (b) Associations between RRAGB expression and MSI in COAD; (c) Associations between RRAGB expression and TNB in COAD; (d) Associations between RRAGB expression and TMB in COAD
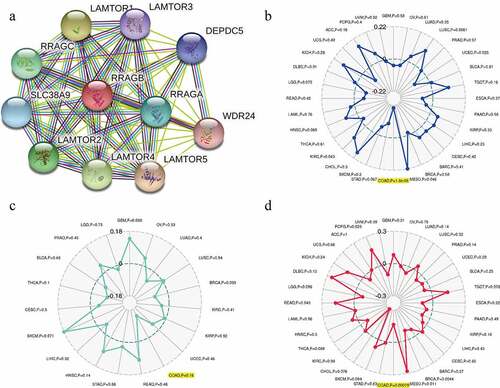
Figure 7. Associations between RRAGB expression and tumor immune infiltration, SCNA, tumor microenvironment in COAD; (a) Associations between RRAGB expression and tumor immune infiltration in COAD from TCGA dataset; (b) Associations between RRAGB expression and SCNA in COAD from TCGA dataset; (c) Associations between RRAGB expression and tumor microenvironment in COAD from TCGA dataset; *P < 0.05; **P < 0.05; ***P < 0.001
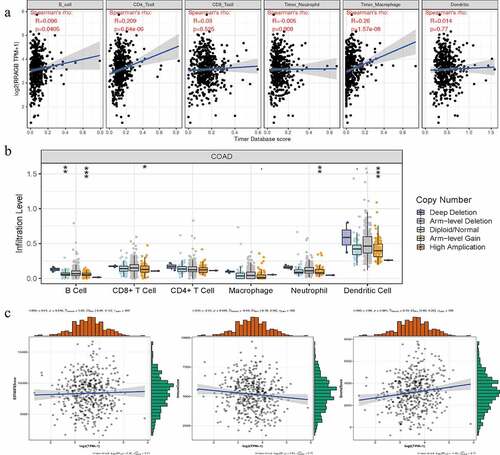
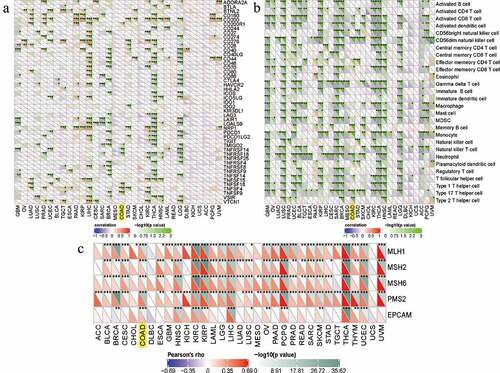
Figure 8. Correlations between RRAGB expression and immune checkpoint molecules, immune cells pathway, mismatch repair genes in COAD; (a) Correlations between RRAGB expression and immune checkpoint molecules in COAD from TCGA dataset; (b) Correlations between RRAGB expression and immune cells pathway in COAD from TCGA dataset; (c) Correlations between RRAGB expression and mismatch repair genes in COAD from TCGA dataset; *P < 0.05; **P < 0.05; ***P < 0.001
Supplemental Material
Download ()Availability of data and material
All data and clinical information could be obtained from The Cancer Genome Atlas (TCGA) database (https://portal.gdc.cancer.gov/).