Figures & data
Figure 1. Effects of dendrobine on HUVEC proliferation. (a) Results of Cell Counting Kit-8 assay. (b) Evaluation of HUVEC proliferation through BrdU staining. Dend-L: the low concentration of dendrobine, 1 µM; Dend-M: the medium concentration of dendrobine, 5 µM; Dend-H: the high concentration of dendrobine, 10 µM. HUVEC, human umbilical vein endothelial cell; BrdU, bromodeoxyuridine. ***P < 0.001 Vs Control, $P < 0.05 Vs TM+Dend-L, @@P < 0.01 VS TM (Model)
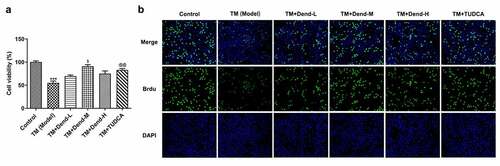
Figure 2. Effects of dendrobine on apoptosis. (a and b) Results of TUNEL staining for apoptosis. ***P < 0.001 Vs Control, ###P < 0.001 Vs TM (Model), $$$P < 0.001 Vs TM+Dend-L, &&&P < 0.001 Vs TM+Dend-M, @@@P < 0.01 VS TM (Model)
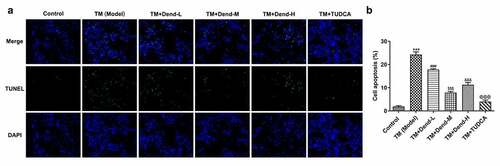
Figure 3. Assessment of endoplasmic reticulum stress-related proteins levels following treatment with dendrobine. Results of western blot analysis of GRP78, Ire1, caspase-4, CHOP and caspase3 expression. GRP78, 78-kDa glucose-regulated protein; Ire1, inositol-requiring enzyme 1; CHOP, C/EBP homologous protein. ***P < 0.001 Vs Control, #P < 0.05 Vs TM (Model), $P < 0.05, $$$P < 0.001 or Vs TM+Dend-L, &P < 0.05, &&P < 0.01 or &&&P < 0.001 Vs TM+Dend-M, @@@P < 0.01 VS TM (Model)
Figure 4. Assessment of miR-381-3p expression following treatment with dendrobine. Results of reverse transcription-quantitative PCR analysis for miR-381-3p expression. miR, microRNA. ***P < 0.001 Vs Control, #P < 0.05 Vs TM (Model), $$P < 0.01 or Vs TM+Dend-L, &&P < 0.01 Vs TM+Dend-M, @@@P < 0.01 VS TM (Model)
Figure 5. miR-381-3p binds to the 3ʹ-untranslated regions of caspase-4. (a) Binding sites predicted by starBase. (b) Results of dual-luciferase reporter assay. miR, micoRNA. ***P < 0.001 Vs WT+ Caspase4+ NC mimic
Figure 6. miR-381-3p affected the protein levels of caspase-4. (a) Reverse transcription-quantitative PCR analysis of miR-381-3p levels. (b) mRNA levels of caspase-4 following miR-381-3p mimic or inhibitor transfection. (c) Protein levels of caspase-4 following miR-381-3p mimic or inhibitor transfection. miR, microRNA. ***P < 0.001 Vs miR-381-3p NC, ### P < 0.001 Vs miR-381-3p mimic
Figure 7. Effects of miR-381-3p mimic or inhibitor on cell proliferation and apoptosis. (a) Results of Cell Counting Kit-8 assay for cell proliferation following miR-381-3p mimic or inhibitor transfection. (b and c) Results of TUNEL staining for cell apoptosis following miR-381-3p mimic or inhibitor transfection. miR, microRNA
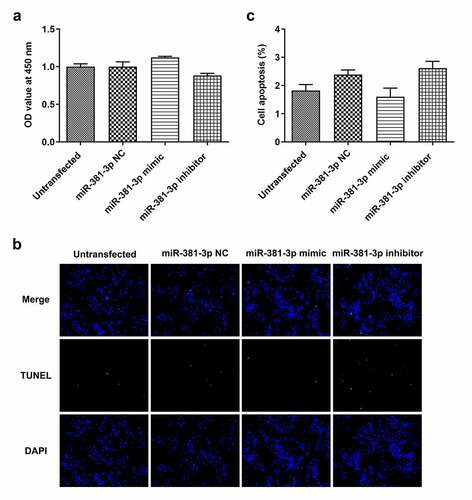
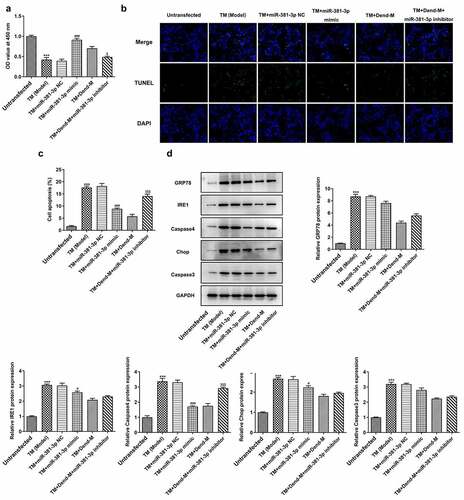
Figure 8. Effects of miR-381-3p mimic or inhibitor on cell proliferation and apoptosis following TM induction. (a) Results of Cell Counting Kit-8 assay. (b and c) Evaluation of apoptosis through TUNEL assay. (d) Detection of ERS-related proteins levels through western blot analysis. TM, tunicamycin; ERS, endoplasmic reticulum stress; miR, microRNA. ***P < 0.001 Vs Control, ### P < 0.001 Vs TM+miR-381-3p NC, <0.05, $$$P < 0.001 Vs TM+Dend-M