Figures & data
Table 1. RT-qPCR primer sequence
Table 2. Correlation analysis of lncGAS5 with clinicopathological characteristics in AMI patients
Figure 1. Expression of lncGAS5 in clinical samples.LncGAS5 expression in the blood of AMI patients before and after PCI was detected by RT-qPCR; one-way ANOVA was applied to calculate the significance of each group; the variance was corrected via Tukey’s test. *P < 0.05
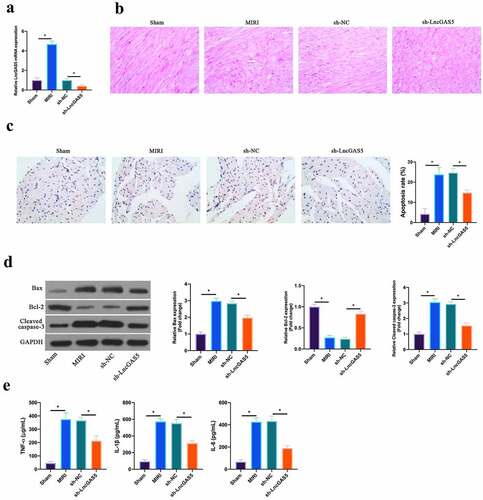
Figure 2. LncGAS5 is upregulated in MIRI and silencing LncGAS5 inhibits MIRI.A. RT-qPCR to detect LncGAS5 expression in mice myocardial tissues in the Sham, the MIRI, the sh-NC, and the sh-LncGAS5 groups; B. HE staining representative images of in mice myocardial tissues in the Sham, the MIRI, the sh-NC, and the sh-LncGAS5 groups; C. TUNEL staining to in mice myocardial tissue apoptosis in the Sham, the MIRI, the sh-NC, and the sh-LncGAS5 groups; D. Western blot to check Bax, Bcl-2 and lysed caspase-3 expressions in mice myocardial tissues in the Sham, the MIRI, the sh-NC, and the sh-LncGAS5 groups; E. ELISA to examine TNF-α, IL-1β and IL-6 levels in mice myocardial tissues in the Sham, the MIRI, the sh-NC, and the sh-LncGAS5 groups; the value was expressed as mean ± SD (n = 3); one-way ANOVA was applied to calculate the significance of each group; the variance was corrected via Tukey’s test. *P < 0.05
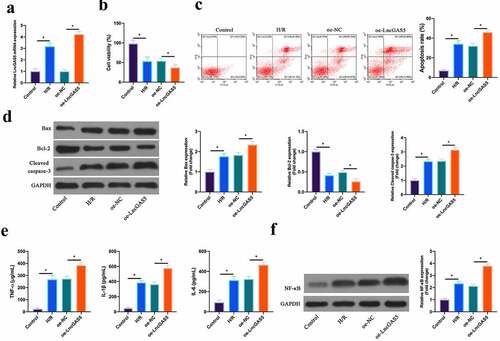
Figure 3. Overexpressing LncGAS5 promotes MIRI.A. RT-qPCR to detect LncGAS5 expression in HL-1 cells in the Control, the H/R, the oe-NC, the oe-LncGAS5 groups; B. CCK-8 to check HL-1 cell viability in the Control, the H/R, the oe-NC, the oe-LncGAS5 groups; C. Flow cytometry to check HL-1 cell apoptosis in the Control, the H/R, the oe-NC, the oe-LncGAS5 groups; D. Western blot to check Bax, Bcl-2 and lysed caspase-3 expressions in HL-1 cells in the Control, the H/R, the oe-NC, the oe-LncGAS5 groups; E. ELISA to examine TNF-α, IL-1β, and IL-6 levels in HL-1 cells in the Control, the H/R, the oe-NC, the oe-LncGAS5 groups; F. Western blot to examine NF-κB p65 expression in HL-1 cells in the Control, the H/R, the oe-NC, the oe-LncGAS5 groups; the value was expressed as mean ± SD (n = 3); one-way ANOVA was applied to calculate the significance of each group; the variance was corrected via Tukey’s test. *P < 0.05
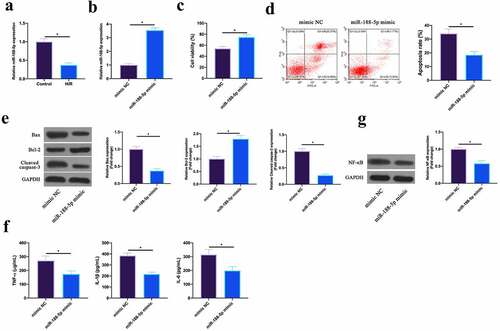
Figure 4. Upregulating miR-188-5p inhibits MIRI.A. RT-qPCR to detect LncGAS5 expression in HL-1 cells in the Control and the H/R groups; B. RT-qPCR to detect LncGAS5 expression in HL-1 cells in the mimic NC and the miR-188-5p mimic groups; C. CCK-8 to check HL-1 cell viability in the mimic NC and the miR-188-5p mimic groups; the si-NC and the si-SMAD2 groups; D. Flow cytometry to check HL-1 cell apoptosis in the mimic NC and the miR-188-5p mimic groups; E. Western blot to check Bax, Bcl-2 and lysed caspase-3 expressions in HL-1 cells in the mimic NC and the miR-188-5p mimic groups; F. ELISA to examine TNF-α, IL-1β, and IL-6 levels in HL-1 cells in the mimic NC and the miR-188-5p mimic groups; G. Western blot to examine NF-κB p65 expression in HL-1 cells in the mimic NC and the miR-188-5p mimic groups; the value was expressed as mean ± SD (n = 3); one-way ANOVA was applied to calculate the significance of each group; the variance was corrected via Tukey’s test. *P < 0.05
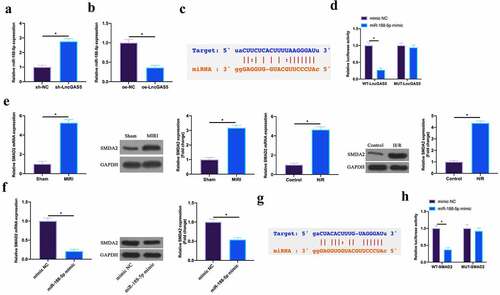
Figure 5. LncGAS5 acts as a sponge of miR-188-5p to regulate SMAD2 expression.A. RT-qPCR to detect miR-188-5p expression in mice cardiomyocytes in the sh-NC and the sh-LncGAS5 groups; B. RT-qPCR to detect miR-188-5p expression in HL-1 cells in the oe-NC and the oe-LncGAS5 groups; C. Bioinformatics website http.//starbase.sysu.edu.cn/ to predict the potential-binding sites of LncGAS5 and miR-188-5p; D. Dual luciferase reporter experiment to check targeting relationship between LncGAS5 and miR-188-5p; E. RT-qPCR and western blot to detect SMAD2 expression in mice myocardial tissue in the Sham and the MIRI groups as well as in HL-1 cells in the Control and the H/R groups; F. RT-qPCR and western blot to detect SMAD2 expression in HL-1 cells in the mimic NC and the miR-188-5p mimic groups; G. Bioinformatics website http://starbase.sysu.edu.cn/ to predict potential-binding sites of SMAD2 and miR-188-5p; H. Dual luciferase reporter experiment to check targeting relationship between SMAD2 and miR-188-5p; the value was expressed as mean ± SD (n = 3); one-way ANOVA was applied to calculate the significance of each group; the variance was corrected via Tukey’s test. *P < 0.05
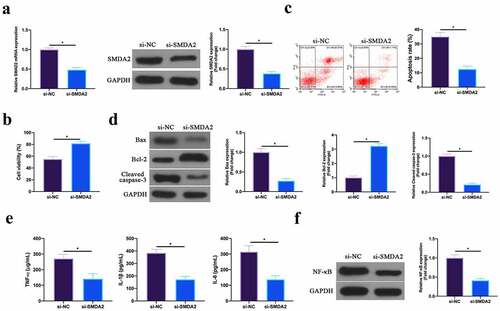
Figure 6. Silencing SMAD2 inhibits MIRI.A. RT-qPCR and western blot to detect SMAD2 expression in HL-1 cells in the si-NC and the si-SMAD2 groups; B. CCK-8 to check HL-1 cell viability in the si-NC and the si-SMAD2 groups; C. Flow cytometry to check HL-1 cell apoptosis in the si-NC and the si-SMAD2 groups; D. Western blot to check Bax, Bcl-2 and lysed caspase-3 expression in HL-1 cells in the si-NC and the si-SMAD2 groups; E. ELISA to examine TNF-α, IL-1β and IL-6 levels in HL-1 cells in the si-NC and the si-SMAD2 groups; F. Western blot to examine NF-κB p65 expression in HL-1 cells in the si-NC and the si-SMAD2 groups; the value was expressed as mean ± SD (n = 3); one-way ANOVA was applied to calculate the significance of each group; the variance was corrected via Tukey’s test. *P < 0.05
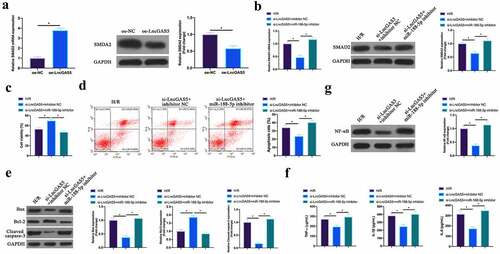
Figure 7. Up-regulated SMAD2 facilitates MIRIA. SMAD2 expression in HL-1 cells of the oe-NC and the oe-SMAD2 groups detected by RT-qPCR and western blot; B. HL-1 cell viability in the oe-NC and the oe-SMAD2 groups examined by CCK-8; C. The apoptosis of HL-1 cells in the oe-NC and the oe-SMAD2 groups detected via flow cytometry; D. The expression of Bax, Bcl-2 and cleaved caspase-3 in HL-1 cells of the oe-NC and the oe-SMAD2 groups examined by western blot; E. Levels of TNF-α, IL-1β and IL-6 in HL-1 cells of the oe-NC and the oe-SMAD2 groups detected by ELISA; F. The expression of NF-κB p65 in HL-1 cells of the oe-NC and the oe-SMAD2 groups examined by western blot. The value was expressed as mean ± SD (n = 3); one-way ANOVA was applied to calculate the significance of each group; the variance was corrected via Tukey’s test. *P < 0.05
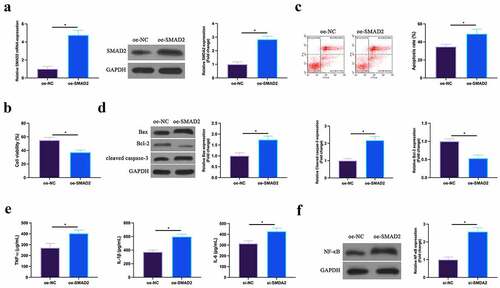
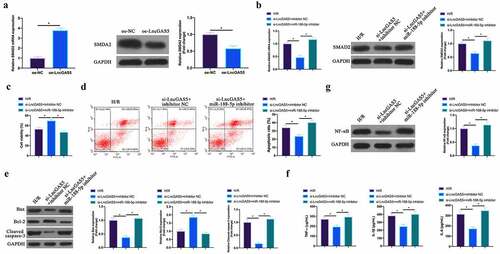
Figure 8. LncGAS5 regulates MIRI development through miR-188-5p/SMAD2 axis.A. RT-qPCR to detect SMAD2 expression in HL-1 cells in the oe-NC and the oe-LncGAS5 groups; B. RT-qPCR to detect SMDA2 expression in HL-1 cells in the H/R, the si-LncGAS5 + inhibitor NC, and the si-LncGAS5 + miR −188-5p inhibitor groups; C. CCK-8 to check HL-1 cell viability in the H/R, the si-LncGAS5 + inhibitor NC, si-LncGAS5 + miR-and 188–5p inhibitor groups; D. Flow cytometry to check HL-1 cell apoptosis in the H/R, the si-LncGAS5 + inhibitor NC, and the si-LncGAS5 + miR-188-5p inhibitor groups; E. Western blot to check Bax, Bcl-2 and lysed caspase-3 expressions in HL-1 cells in the H/R, the si- LncGAS5 + inhibitor NC, and the si-LncGAS5 + miR-188-5p inhibitor groups; F. ELISA to examine TNF-α, IL-1β and IL-6 levels in HL-1 cells in the H/R, the si-LncGAS5 + inhibitor NC, and the Si-LncGAS5 + miR-188-5p inhibitor groups; G. Western blot to examine NF-κB p65 expression in HL-1 cells in the H/R, the si-LncGAS5 + inhibitor NC, and the si-LncGAS5 + miR-188-5p inhibitor groups; the value was expressed as mean ± SD (n = 3); one-way ANOVA was applied to calculate the significance of each group; the variance was corrected via Tukey’s test. *P < 0.05