Figures & data
Figure 1. Kindlin-2 expression is elevated during wound healing. a: Real-time PRC was used to detect the expression of kindlin-2 at 1, 3, 5, 7 and 9 days after injury, and GAPDH was used as an internal reference for quantification of relative expression. Compared with the relative expression of kindlin-2 on day 0, multiple relationships were obtained (P < 0.05). b: The dynamic expression of kindlin-2 protein was detected by Western blots, and GAPDH was used as an internal reference
Figure 2. Effect of Kindlin-2 on wound healing in kindlin-2 (±) mice. a: Kindlin-2 (±) heterozygosity resulted in a bimodal image 350 bp behind that of normal control mice. b: Kindlin-2 gene knockout prolonged the healing time of mouse back wounds, * indicates P < 0.05. c: Skin wounds on day 3 and day 7 were selected, and CD31 (brown) in vascular endothelial cells was identified by immunohistochemistry. The bar = 100 microns. d. Comparison of the differences between the two groups by calculating the absorbance of Evans Blue through skin exudation
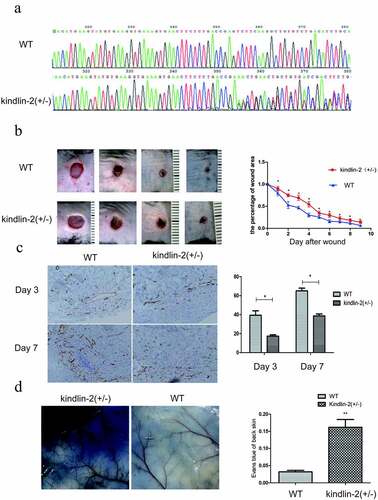
Figure 3. Down-regulation of Kindlin-2 expression inhibits cell migration, cell adhesion and spreading. a: Morphological changes in vascular endothelial cells after 4 hours of adherence were observed by field emission electron microscopy. Bar = 2 μm. The spreading area of cells in each group was calculated by ImageJ. b: The adhesion of cells in each group for 4 hours was observed by immunofluorescence. Bar = 50 microns. The adhesion ability of each group was compared by calculating the number of adherent cells. c: Transwell chamber experiments were conducted to observe the migration changes of the control group, Kindlin-2 shRNA1 group and Kindlin-2 shRNA2 group after 12 hours, bar = 200 μm. d: The migration of the control group, Kindlin-2 shRNA1 group and Kindlin-2 shRNA2 group was observed to be 500 μm by the scratch test. The migration ability of each group was compared by calculating the relative migration distance
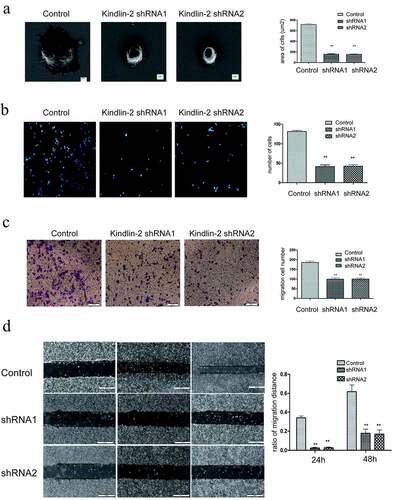
Figure 4. Down-regulation of Kindlin-2 expression inhibits cellular tube formation. a: Tube images of the control group, Kindlin-2 shRNA1 group and Kindlin-2 shRNA2 group cultured on matrix glue; bar: 500 μm. b-d: Quantification of the number of small pipe segments, segments and grids. e: The distribution of tight junctions was detected by immunofluorescent VE-cadherin staining
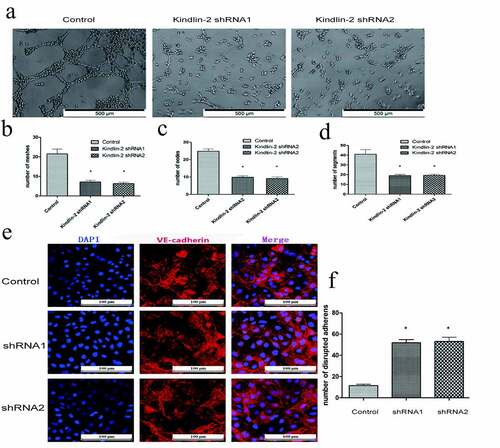
Figure 5. Down-regulation of Kindlin-2 expression inhibits β-catenin nuclear transport. a: β-catenin protein expression in endothelial cells (including cytoplasm and nucleus) was detected by Western blots in the control group, kindlin-2 shRNA1 group and kindlin-2 shRNA2 group. b: The expression of β-catenin protein in the cytoplasm was detected by Western blots in the control group, kindlin-2 shRNA1 group and kindlin-2 shRNA2 group. c: The protein expression of β-catenin in the nucleus was detected by Western blots in the control group, kindlin-2 shRNA1 group and kindlin-2 shRNA2 group. d: The protein expression levels of Met, c-Jun, TCF7 and c-Myc in the control group, Kindlin-2 shRNA1 group and Kindlin-2 shRNA2 group were detected by Western blots